\n
## Line Chart: Transaction Fee vs. Number of Transactions
### Overview
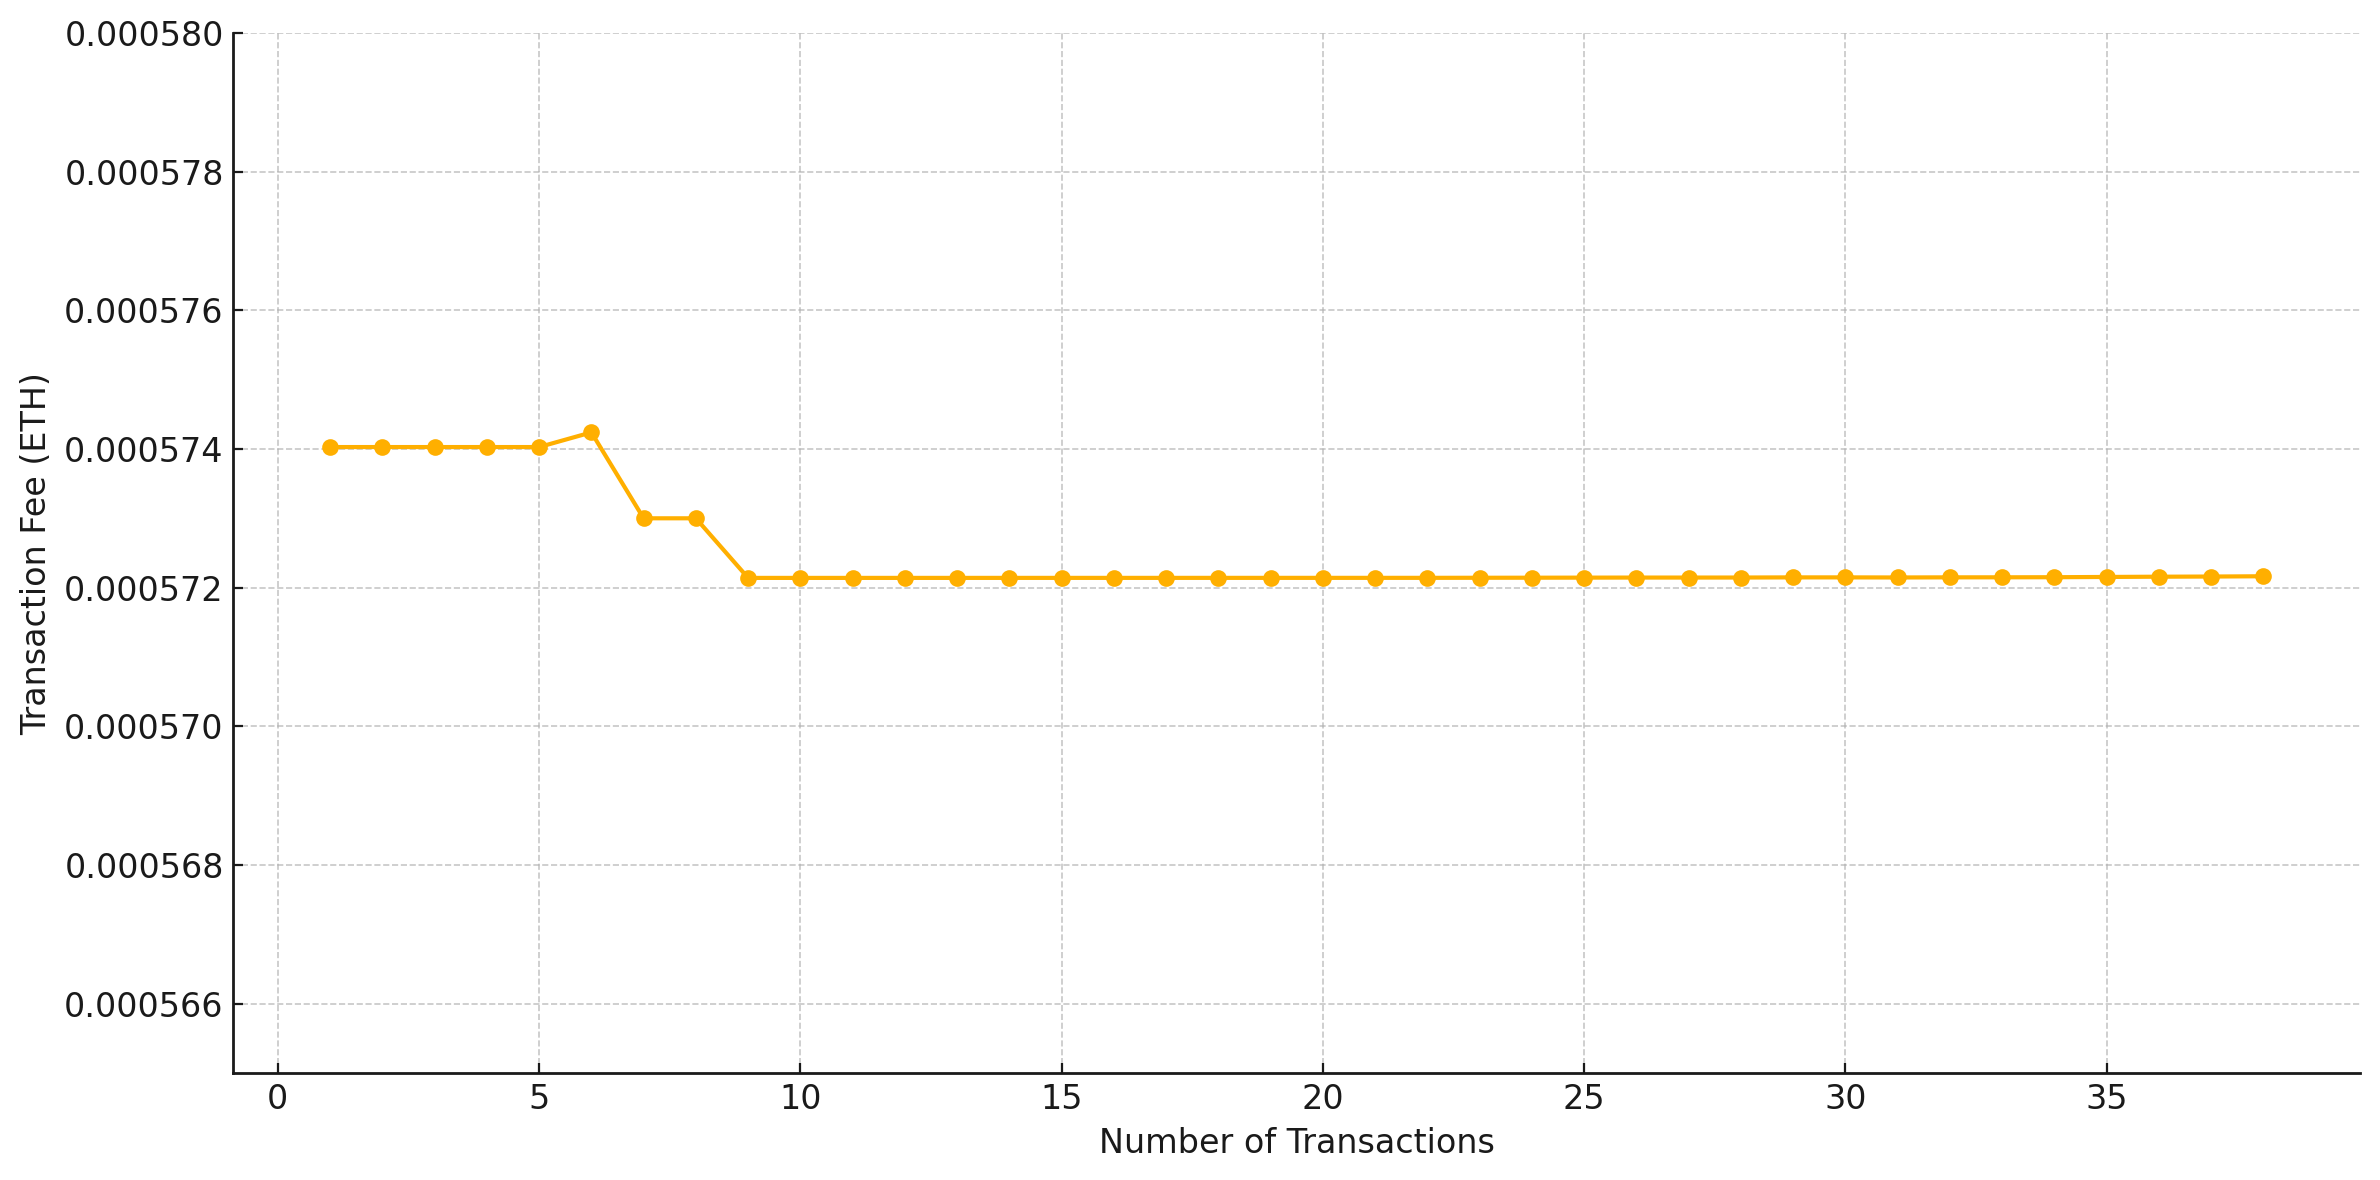
The image displays a line chart plotting the relationship between the number of transactions (x-axis) and the corresponding transaction fee in Ethereum (ETH) (y-axis). The chart shows a single data series represented by an orange line with circular markers at each data point. The overall trend indicates a fee that is largely stable with a minor, stepwise decrease early in the series before plateauing.
### Components/Axes
* **Chart Type:** Line chart with data point markers.
* **X-Axis:**
* **Label:** "Number of Transactions"
* **Scale:** Linear, ranging from 0 to approximately 38.
* **Major Tick Marks:** 0, 5, 10, 15, 20, 25, 30, 35.
* **Y-Axis:**
* **Label:** "Transaction Fee (ETH)"
* **Scale:** Linear, ranging from 0.000566 to 0.000580 ETH.
* **Major Tick Marks:** 0.000566, 0.000568, 0.000570, 0.000572, 0.000574, 0.000576, 0.000578, 0.000580.
* **Data Series:**
* **Color:** Orange (#FFA500 approximate).
* **Marker:** Solid circle.
* **Legend:** Not present (single series).
* **Grid:** Light gray dashed grid lines are present for both major x and y ticks.
### Detailed Analysis
**Trend Verification:** The orange line begins flat, exhibits a small upward bump, then descends in two distinct steps before flattening out completely for the remainder of the chart.
**Data Point Extraction (Approximate Values):**
The following table lists the approximate (x, y) coordinates for each visible data point, read from the chart.
| Number of Transactions (x) | Transaction Fee (ETH) (y) | Notes |
| :--- | :--- | :--- |
| 1 | 0.0005740 | Start of series. |
| 2 | 0.0005740 | |
| 3 | 0.0005740 | |
| 4 | 0.0005740 | |
| 5 | 0.0005740 | |
| 6 | ~0.0005742 | **Peak value.** Slight increase from baseline. |
| 7 | 0.0005730 | First step down. |
| 8 | 0.0005730 | |
| 9 | 0.0005721 | Second step down. |
| 10 | 0.0005721 | |
| 11 | 0.0005721 | |
| 12 | 0.0005721 | |
| 13 | 0.0005721 | |
| 14 | 0.0005721 | |
| 15 | 0.0005721 | |
| 16 | 0.0005721 | |
| 17 | 0.0005721 | |
| 18 | 0.0005721 | |
| 19 | 0.0005721 | |
| 20 | 0.0005721 | |
| 21 | 0.0005721 | |
| 22 | 0.0005721 | |
| 23 | 0.0005721 | |
| 24 | 0.0005721 | |
| 25 | 0.0005721 | |
| 26 | 0.0005721 | |
| 27 | 0.0005721 | |
| 28 | 0.0005721 | |
| 29 | 0.0005721 | |
| 30 | 0.0005721 | |
| 31 | 0.0005721 | |
| 32 | 0.0005721 | |
| 33 | 0.0005721 | |
| 34 | 0.0005721 | |
| 35 | 0.0005721 | |
| 36 | 0.0005721 | |
| 37 | 0.0005721 | |
| 38 | 0.0005721 | End of visible series. |
### Key Observations
1. **Plateaued Baseline:** The fee is constant at 0.0005740 ETH for transactions 1 through 5.
2. **Minor Peak:** A single, slight increase to ~0.0005742 ETH occurs at 6 transactions.
3. **Stepwise Decrease:** The fee drops in two clear steps: first to 0.0005730 ETH (transactions 7-8), then to 0.0005721 ETH (transaction 9 onward).
4. **Extended Plateau:** From 9 transactions to the end of the chart (~38 transactions), the fee remains perfectly constant at 0.0005721 ETH.
5. **Narrow Y-Axis Range:** The entire variation in fee occurs within a very narrow band of 0.0000021 ETH (from 0.0005721 to 0.0005742), indicating high stability.
### Interpretation
This chart demonstrates a transaction fee model with remarkable stability relative to transaction volume. The data suggests one of two scenarios:
1. **Fixed Fee Structure:** The fee is largely predetermined and not sensitive to the number of transactions processed, with minor adjustments possibly due to rounding, network conditions at specific volumes, or a tiered pricing model that changes only at specific thresholds (e.g., after 6 and after 8 transactions).
2. **Efficient Scaling:** The system or protocol being measured handles increased transaction load with negligible impact on per-transaction cost, achieving economies of scale almost immediately (by the 9th transaction).
The notable anomaly is the small peak at 6 transactions. This could represent a specific threshold where a minor fee adjustment occurs before settling into a lower, stable rate. The absence of any upward trend or volatility as transactions increase to 38 is the most significant finding, implying predictable and low marginal cost for additional transactions within this range. The extremely fine scale of the y-axis (0.000002 ETH increments) highlights that while changes are visually distinct, their absolute financial magnitude is minimal.