TECHNICAL ASSET FINGERPRINT
9228f69d0f232ca022de9f37
Click to view fullscreen
Press ESC or click to close
FOUND IN PAPERS
EXPERT: healer-alpha-free VERSION 1
RUNTIME: free/openrouter/healer-alpha
INTEL_VERIFIED
\n
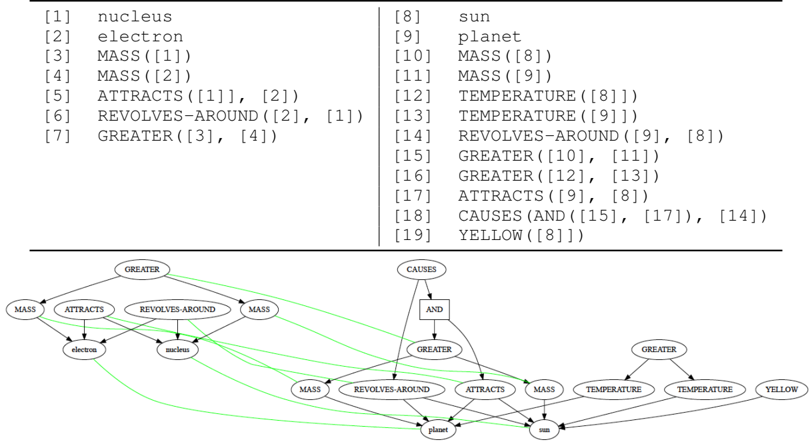
## Diagram: Knowledge Graph of Physical Relationships
### Overview
The image presents a two-part technical diagram illustrating a set of logical propositions and their corresponding graphical representation as a knowledge graph or semantic network. The top section lists 19 numbered statements defining entities and their relationships. The bottom section is a directed graph that visually maps these relationships, with nodes representing concepts and predicates, and arrows representing the connections between them. Some connections are highlighted in green.
### Components/Axes
The diagram is divided into two distinct regions:
**1. Top Section: Proposition List**
This is a two-column, numbered list of logical statements.
* **Left Column (Items 1-7):** Defines atomic-scale entities and relationships.
* [1] nucleus
* [2] electron
* [3] MASS([1])
* [4] MASS([2])
* [5] ATTRACTS([1], [2])
* [6] REVOLVES-AROUND([2], [1])
* [7] GREATER([3], [4])
* **Right Column (Items 8-19):** Defines celestial-scale entities and relationships.
* [8] sun
* [9] planet
* [10] MASS([8])
* [11] MASS([9])
* [12] TEMPERATURE([8])
* [13] TEMPERATURE([9])
* [14] REVOLVES-AROUND([9], [8])
* [15] GREATER([10], [11])
* [16] GREATER([12], [13])
* [17] ATTRACTS([9], [8])
* [18] CAUSES(AND([15], [17]), [14])
* [19] YELLOW([8])
**2. Bottom Section: Knowledge Graph**
This is a node-link diagram. The nodes are ovals containing text (e.g., "nucleus", "MASS", "GREATER"). The links are directed arrows. A subset of arrows is colored green, while the majority are black. The graph is organized with a rough left-to-right flow, starting with atomic concepts and moving to celestial ones.
### Detailed Analysis
**Graph Structure and Connections:**
The graph visually encodes the propositions from the list above. Each numbered proposition corresponds to a subgraph.
* **Atomic System (Left Side):**
* Nodes: `nucleus`, `electron`, `MASS` (x2), `ATTRACTS`, `REVOLVES-AROUND`, `GREATER`.
* Connections: `MASS` nodes point to `nucleus` and `electron`. `ATTRACTS` has arrows pointing to both `nucleus` and `electron`. `REVOLVES-AROUND` has arrows from `electron` and to `nucleus`. `GREATER` has arrows from the two `MASS` nodes.
* **Green Highlighting:** All arrows connecting the `GREATER` node to the two `MASS` nodes, and from those `MASS` nodes to the `nucleus` and `electron`, are green. This highlights the relationship that the nucleus's mass is greater than the electron's mass.
* **Celestial System (Right Side):**
* Nodes: `sun`, `planet`, `MASS` (x2), `TEMPERATURE` (x2), `REVOLVES-AROUND`, `ATTRACTS`, `GREATER` (x2), `CAUSES`, `AND`, `YELLOW`.
* Connections: This is more complex. Key structures include:
* A `CAUSES` node at the top center. It has an arrow pointing to an `AND` gate node.
* The `AND` gate receives inputs from a `GREATER` node (comparing masses) and the `ATTRACTS` node.
* The output of the `AND` gate points to the `REVOLVES-AROUND` relationship between `planet` and `sun`.
* Separate `GREATER` and `TEMPERATURE` nodes compare the sun and planet.
* A `YELLOW` node points only to the `sun`.
* **Green Highlighting:** A dense network of green arrows connects the `CAUSES` -> `AND` -> `REVOLVES-AROUND` chain. Specifically, green arrows flow from the `CAUSES` node, through the `AND` gate, and down to the `REVOLVES-AROUND` node, and also from the contributing `GREATER` (mass) and `ATTRACTS` nodes into this causal chain. This visually emphasizes the core causal argument: that the combination of greater mass and attraction causes the planet to revolve around the sun.
### Key Observations
1. **Analogical Structure:** The diagram explicitly draws an analogy between the micro (atom) and macro (solar system) scales. Both systems feature a central body (nucleus/sun) and an orbiting body (electron/planet), governed by mass, attraction, and revolution.
2. **Logical Formalization:** The list uses a predicate logic-like syntax (e.g., `MASS([1])`, `CAUSES(AND(...), ...)`). The graph is a direct visualization of this formal logic.
3. **Highlighted Causal Chain:** The green coloring is not random. It specifically traces the logical premises (`MASS` comparisons, `ATTRACTS`) that feed into the `AND` condition, which is then shown as the cause (`CAUSES`) for the orbital motion (`REVOLVES-AROUND`). This is the central argument of the diagram.
4. **Asymmetry in Detail:** The celestial system (right) is modeled with greater complexity, including a `TEMPERATURE` comparison and a `YELLOW` property for the sun, which have no direct analog in the atomic system model shown.
5. **Spatial Grounding:** The `CAUSES` node is positioned centrally above the main celestial graph, acting as a top-level explanation. The `AND` gate is directly below it, mediating between the premises and the conclusion (`REVOLVES-AROUND`).
### Interpretation
This diagram is a **formal knowledge representation** illustrating a **physical analogy**. It does not present empirical data but rather a structured, logical model of relationships.
* **What it Demonstrates:** The core message is that the same fundamental principles—differential mass leading to gravitational attraction, which in turn causes orbital motion—can be used to model both atomic structure and planetary dynamics. The `CAUSES` and `AND` nodes make this explanatory relationship explicit.
* **Relationships Between Elements:** The list provides the axiomatic definitions. The graph shows how these axioms interconnect to form coherent systems. The green highlighting performs a "trace" function, isolating and emphasizing the specific logical pathway that constitutes the causal explanation for revolution.
* **Notable Anomalies/Outliers:** The inclusion of `TEMPERATURE` and `YELLOW` for the sun, without corresponding properties for the nucleus, suggests the model is either incomplete or intentionally focused on the gravitational analogy, treating other properties (like the sun's color) as ancillary facts.
* **Peircean Investigation:** From a semiotic perspective, the diagram uses **icons** (the graph structure resembles the conceptual relationships), **indices** (the arrows point from cause to effect, premise to conclusion), and **symbols** (the formal logic syntax). The green color acts as an **indexical sign**, directing the viewer's attention to the most important interpretive path through the network—the causal argument. The diagram argues that understanding the solar system is *like* understanding an atom, and provides the logical scaffolding to support that claim.
DECODING INTELLIGENCE...