## Line Graph: Performance Comparison of Two Models
### Overview
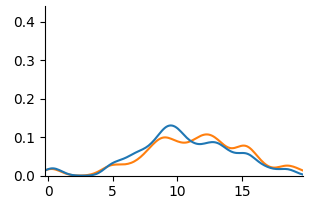
The image depicts a line graph comparing the performance of two models (Model A and Model B) over a time interval from 0 to 15. The y-axis represents performance (0–0.4), while the x-axis represents time. Two distinct lines—blue (Model A) and orange (Model B)—show fluctuating performance trends, with both models peaking and declining over time.
### Components/Axes
- **X-axis (Time)**: Labeled "0" to "15" in increments of 5.
- **Y-axis (Performance)**: Labeled "0" to "0.4" in increments of 0.1.
- **Legend**: Located at the bottom-right corner.
- Blue line: "Model A"
- Orange line: "Model B"
### Detailed Analysis
1. **Model A (Blue Line)**:
- Starts near 0.02 at time 0.
- Rises to a peak of ~0.12 at time 10.
- Declines to ~0.07 at time 14, then stabilizes near 0.03 by time 15.
- Key data points:
- Time 5: ~0.05
- Time 10: ~0.12 (peak)
- Time 12: ~0.09
- Time 14: ~0.07
2. **Model B (Orange Line)**:
- Begins near 0.01 at time 0.
- Peaks at ~0.11 at time 11.
- Declines to ~0.06 at time 15.
- Key data points:
- Time 5: ~0.03
- Time 11: ~0.11 (peak)
- Time 13: ~0.08
- Time 15: ~0.06
### Key Observations
- Both models exhibit similar trends: initial growth, peaking, and gradual decline.
- Model A achieves a higher peak (~0.12 vs. ~0.11) but declines faster.
- Model B’s performance is more sustained but lower overall.
- The lines intersect near time 8 (~0.07 for both), suggesting parity at that point.
### Interpretation
The graph suggests a comparison of efficiency or accuracy between two models under similar conditions. Model A’s earlier and sharper peak may indicate faster initial performance but less stability over time. Model B’s slower rise and steadier decline could imply robustness but lower maximum capability. The intersection at time 8 highlights a critical point where both models perform equivalently, potentially useful for decision-making thresholds. The declining trends after peaks might reflect resource exhaustion, diminishing returns, or external constraints affecting both models. Further context (e.g., domain, variables) would clarify the practical implications of these trends.