# Technical Document Extraction: Heatmap Analysis
## Main Title
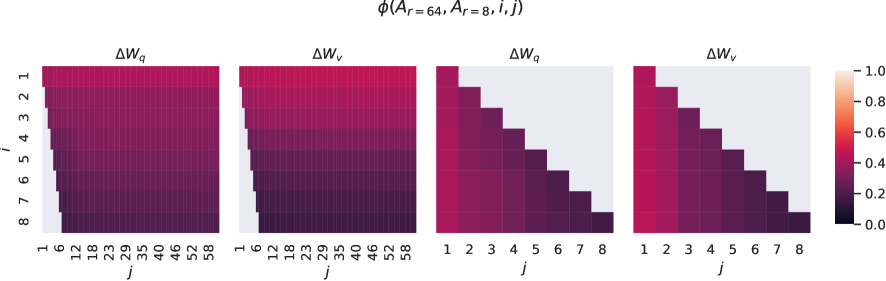
**φ(A<sub>r</sub>=64, A<sub>r</sub>=8, i, j)**
---
### Heatmap 1: ΔW<sub>q</sub> (A<sub>r</sub>=64)
- **X-axis (j)**: 1 to 58 (incrementing by 1)
- **Y-axis (i)**: 1 to 8 (incrementing by 1)
- **Color Scale**: 0.0 (dark purple) to 1.0 (light pink)
- **Key Observations**:
- Uniform color intensity across all rows (i=1 to 8).
- No visible gradient or variation in ΔW<sub>q</sub> values.
---
### Heatmap 2: ΔW<sub>v</sub> (A<sub>r</sub>=64)
- **X-axis (j)**: 1 to 8 (incrementing by 1)
- **Y-axis (i)**: 1 to 8 (incrementing by 1)
- **Color Scale**: 0.0 (dark purple) to 1.0 (light pink)
- **Key Observations**:
- Gradual darkening from top to bottom (i=1 to 8).
- Higher ΔW<sub>v</sub> values concentrated in lower rows (i=1).
---
### Heatmap 3: ΔW<sub>q</sub> (A<sub>r</sub>=8)
- **X-axis (j)**: 1 to 7 (incrementing by 1)
- **Y-axis (i)**: 1 to 8 (incrementing by 1)
- **Color Scale**: 0.0 (dark purple) to 1.0 (light pink)
- **Key Observations**:
- Staircase-like gradient: Darker shades dominate lower j values (j=1 to 3).
- Lighter shades increase with higher j values (j=4 to 7).
---
### Heatmap 4: ΔW<sub>v</sub> (A<sub>r</sub>=8)
- **X-axis (j)**: 1 to 8 (incrementing by 1)
- **Y-axis (i)**: 1 to 8 (incrementing by 1)
- **Color Scale**: 0.0 (dark purple) to 1.0 (light pink)
- **Key Observations**:
- Diagonal gradient: Darker shades cluster in the upper-left (i=1, j=1).
- Lighter shades increase along the diagonal toward the bottom-right (i=8, j=8).
---
### Color Bar Legend
- **Range**: 0.0 (dark purple) to 1.0 (light pink)
- **Gradient**: Smooth transition from dark to light, indicating ΔW<sub>q/v</sub> magnitude.
---
### Summary of Parameters
| Heatmap | ΔW Type | A<sub>r</sub> | j Range | i Range |
|---------------|---------|--------------|---------|---------|
| Heatmap 1 | ΔW<sub>q</sub> | 64 | 1–58 | 1–8 |
| Heatmap 2 | ΔW<sub>v</sub> | 64 | 1–8 | 1–8 |
| Heatmap 3 | ΔW<sub>q</sub> | 8 | 1–7 | 1–8 |
| Heatmap 4 | ΔW<sub>v</sub> | 8 | 1–8 | 1–8 |
---
### Notes
- **A<sub>r</sub>** values (64 and 8) likely represent different experimental conditions or model parameters.
- **ΔW<sub>q</sub>** and **ΔW<sub>v</sub>** may denote distinct metrics (e.g., query vs. value weights in a neural network).
- The decreasing j ranges in Heatmaps 3 and 4 suggest a focus on smaller subsets of data for A<sub>r</sub>=8.