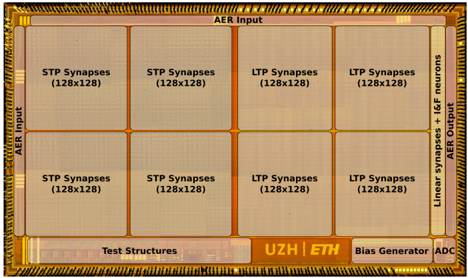
## System Architecture Diagram: Neuromorphic Chip Layout
### Overview
The image depicts a technical diagram of a neuromorphic chip architecture, divided into labeled functional blocks. It illustrates input/output interfaces, synaptic processing units, test structures, and output processing components. The layout emphasizes modularity, with repeated 128x128 synapse blocks and specialized regions for plasticity and signal conversion.
### Components/Axes
- **AER Input**: Top-left labeled region for input signals.
- **STP Synapses (128x128)**: Six blocks labeled "STP Synapses" with dimensions (128x128), arranged in two rows (top-left and bottom-left).
- **LTP Synapses (128x128)**: Four blocks labeled "LTP Synapses" with dimensions (128x128), arranged in two rows (top-right and bottom-right).
- **Test Structures**: Bottom-center labeled region.
- **UZH | ETH**: Bottom-center orange block with text "UZH | ETH" (likely abbreviations for institutions or modules).
- **Bias Generator**: Bottom-right labeled region.
- **ADC**: Bottom-right labeled region adjacent to Bias Generator.
- **AER Output**: Right-side vertical label for output signals.
- **Linear Synapses + I&F Neurons**: Vertical column on the far right, labeled "Linear synapses + I&F neurons."
### Detailed Analysis
- **Synapse Blocks**:
- All STP and LTP synapse blocks are uniformly sized (128x128).
- STPs are grouped in clusters (2x3 total), while LTPs are in clusters (2x2 total).
- **Flow Path**:
- Input → AER Input → STP/LTP Synapses → Test Structures → UZH/ETH → Bias Generator/ADC → Linear Synapses + I&F Neurons → AER Output.
- **Text Elements**:
- "UZH | ETH" is highlighted in orange, suggesting a critical processing unit.
- "Test Structures" and "Bias Generator" are positioned to indicate calibration or control functions.
### Key Observations
1. **Modular Design**: Repeated 128x128 synapse blocks suggest scalability and uniformity in synaptic processing.
2. **Plasticity Layers**: STPs (short-term plasticity) and LTPs (long-term plasticity) are spatially separated but adjacent, indicating hierarchical processing.
3. **Output Specialization**: The far-right column combines linear synapses and I&F (Integrate-and-Fire) neurons, typical of spiking neural network outputs.
4. **Institutional Branding**: "UZH | ETH" implies collaboration between University of Zurich (UZH) and ETH Zurich, possibly in chip design or research.
### Interpretation
This diagram represents a neuromorphic computing system optimized for energy-efficient, event-driven processing. The separation of STP and LTP synapses reflects biological neuron behavior, where short-term and long-term memory mechanisms are spatially distinct. The inclusion of "Test Structures" and "Bias Generator" highlights the importance of calibration in analog-digital mixed-signal chips. The "UZH | ETH" branding suggests academic or industrial collaboration, possibly in neuromorphic hardware development. The architecture’s flow from AER input to AER output mirrors biological sensory-to-motor pathways, emphasizing its application in real-time, low-power AI systems.
**Note**: No numerical data or trends are present; the diagram focuses on structural and functional relationships.