\n
## Diagram: Process Flow with Variable Nodes
### Overview
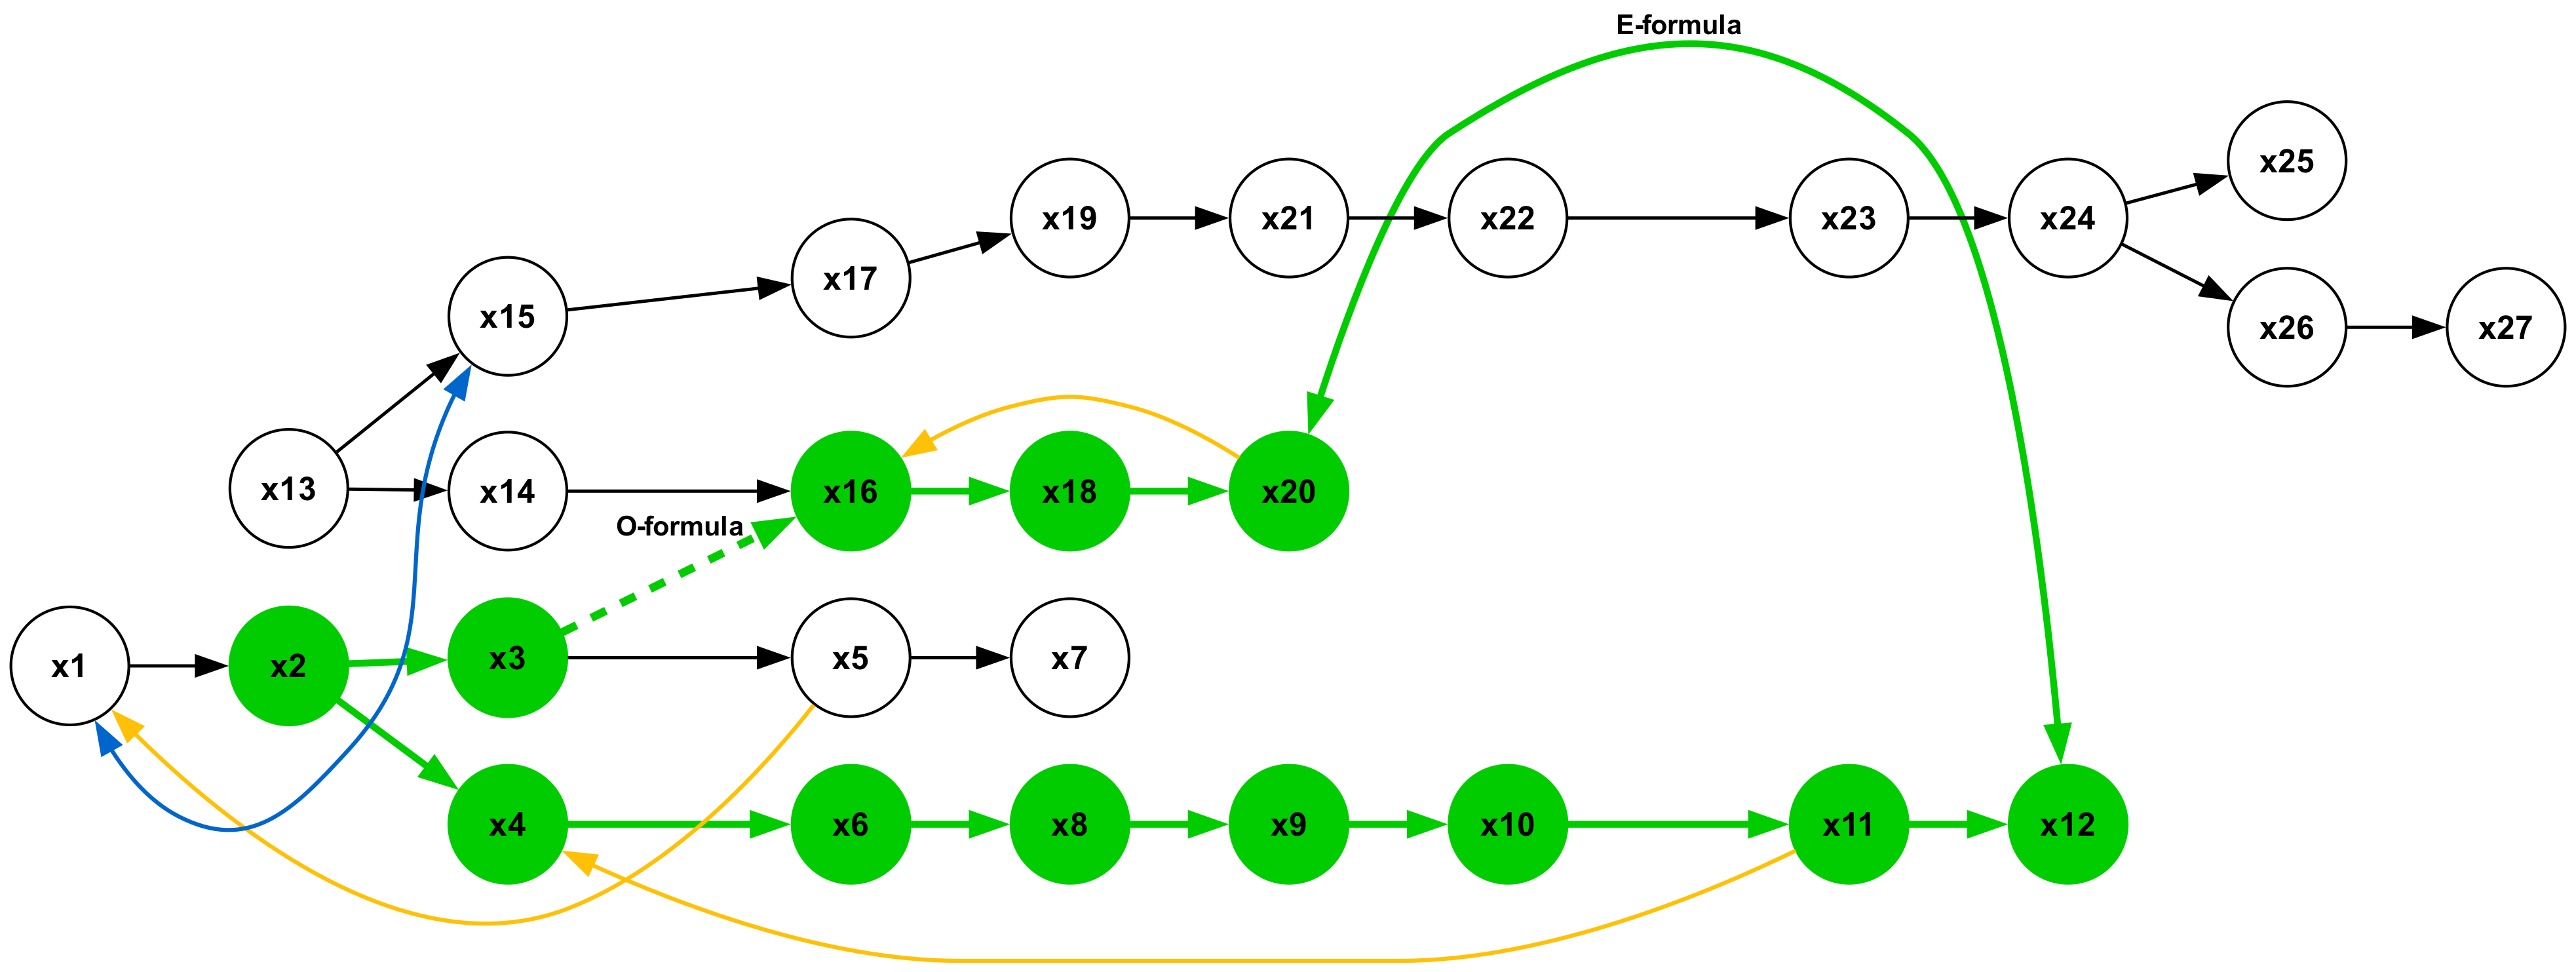
The image depicts a directed graph representing a process flow with 27 nodes labeled 'x1' through 'x27'. The nodes are interconnected by arrows indicating the direction of the flow. Two distinct formulas, "E-formula" and "O-formula", are indicated by curved green arrows forming loops within the graph. The nodes are colored green, with some connections highlighted in blue and yellow.
### Components/Axes
The diagram consists of:
* **Nodes:** 27 circular nodes labeled x1 to x27.
* **Arrows:** Directed arrows indicating the flow between nodes.
* **Formulas:** Two labeled loops: "E-formula" (green arc) and "O-formula" (green arc).
* **Colors:** Green nodes, blue arrows, yellow arrows, and green formula arcs.
### Detailed Analysis or Content Details
The diagram can be broken down into sections based on the flow:
1. **Initial Branch:** x1 connects to x2 and x13 (blue arrow).
2. **Main Flow (Green):**
* x2 connects to x3.
* x3 connects to x5.
* x5 connects to x7.
* x7 connects to x8.
* x8 connects to x9.
* x9 connects to x10.
* x10 connects to x11.
* x11 connects to x12.
3. **Secondary Flow (Green):**
* x4 connects to x6.
* x6 connects to x8.
4. **O-formula Loop (Green):**
* x13 connects to x14.
* x14 connects to x16.
* x16 connects to x18.
* x18 connects to x20.
* x20 connects back to x14.
5. **E-formula Loop (Green):**
* x21 connects to x22.
* x22 connects to x23.
* x23 connects to x24.
* x24 connects to x25.
* x25 connects to x26.
* x26 connects to x27.
* x27 connects back to x21.
6. **Connections between Flows:**
* x15 connects to x17.
* x17 connects to x19.
* x19 connects to x21.
* x12 connects to x24.
* x20 connects to x22.
### Key Observations
* The diagram represents a complex system with multiple interconnected pathways.
* The "E-formula" and "O-formula" loops suggest iterative processes or feedback mechanisms.
* The blue and yellow arrows highlight specific connections that may be of particular importance.
* Node x8 is a convergence point for two separate flows (from x7 and x6).
* Node x21 is the starting point of the E-formula loop.
* Node x14 is the starting point of the O-formula loop.
### Interpretation
The diagram likely represents a state machine, a workflow, or a computational process. The nodes represent states or variables, and the arrows represent transitions or operations. The "E-formula" and "O-formula" loops suggest recursive or iterative calculations. The use of different colors for the arrows may indicate different types of transitions or dependencies.
The diagram suggests a system where data flows through a series of processing steps, with feedback loops that allow for refinement or adjustment. The convergence point at x8 indicates a potential integration or combination of different data streams. The diagram is abstract and does not provide specific information about the nature of the process or the meaning of the variables. It is a high-level representation of the system's structure and flow. Without additional context, it is difficult to determine the specific purpose or function of the diagram.