# Technical Document Extraction: Flowchart Analysis
## 1. Diagram Overview
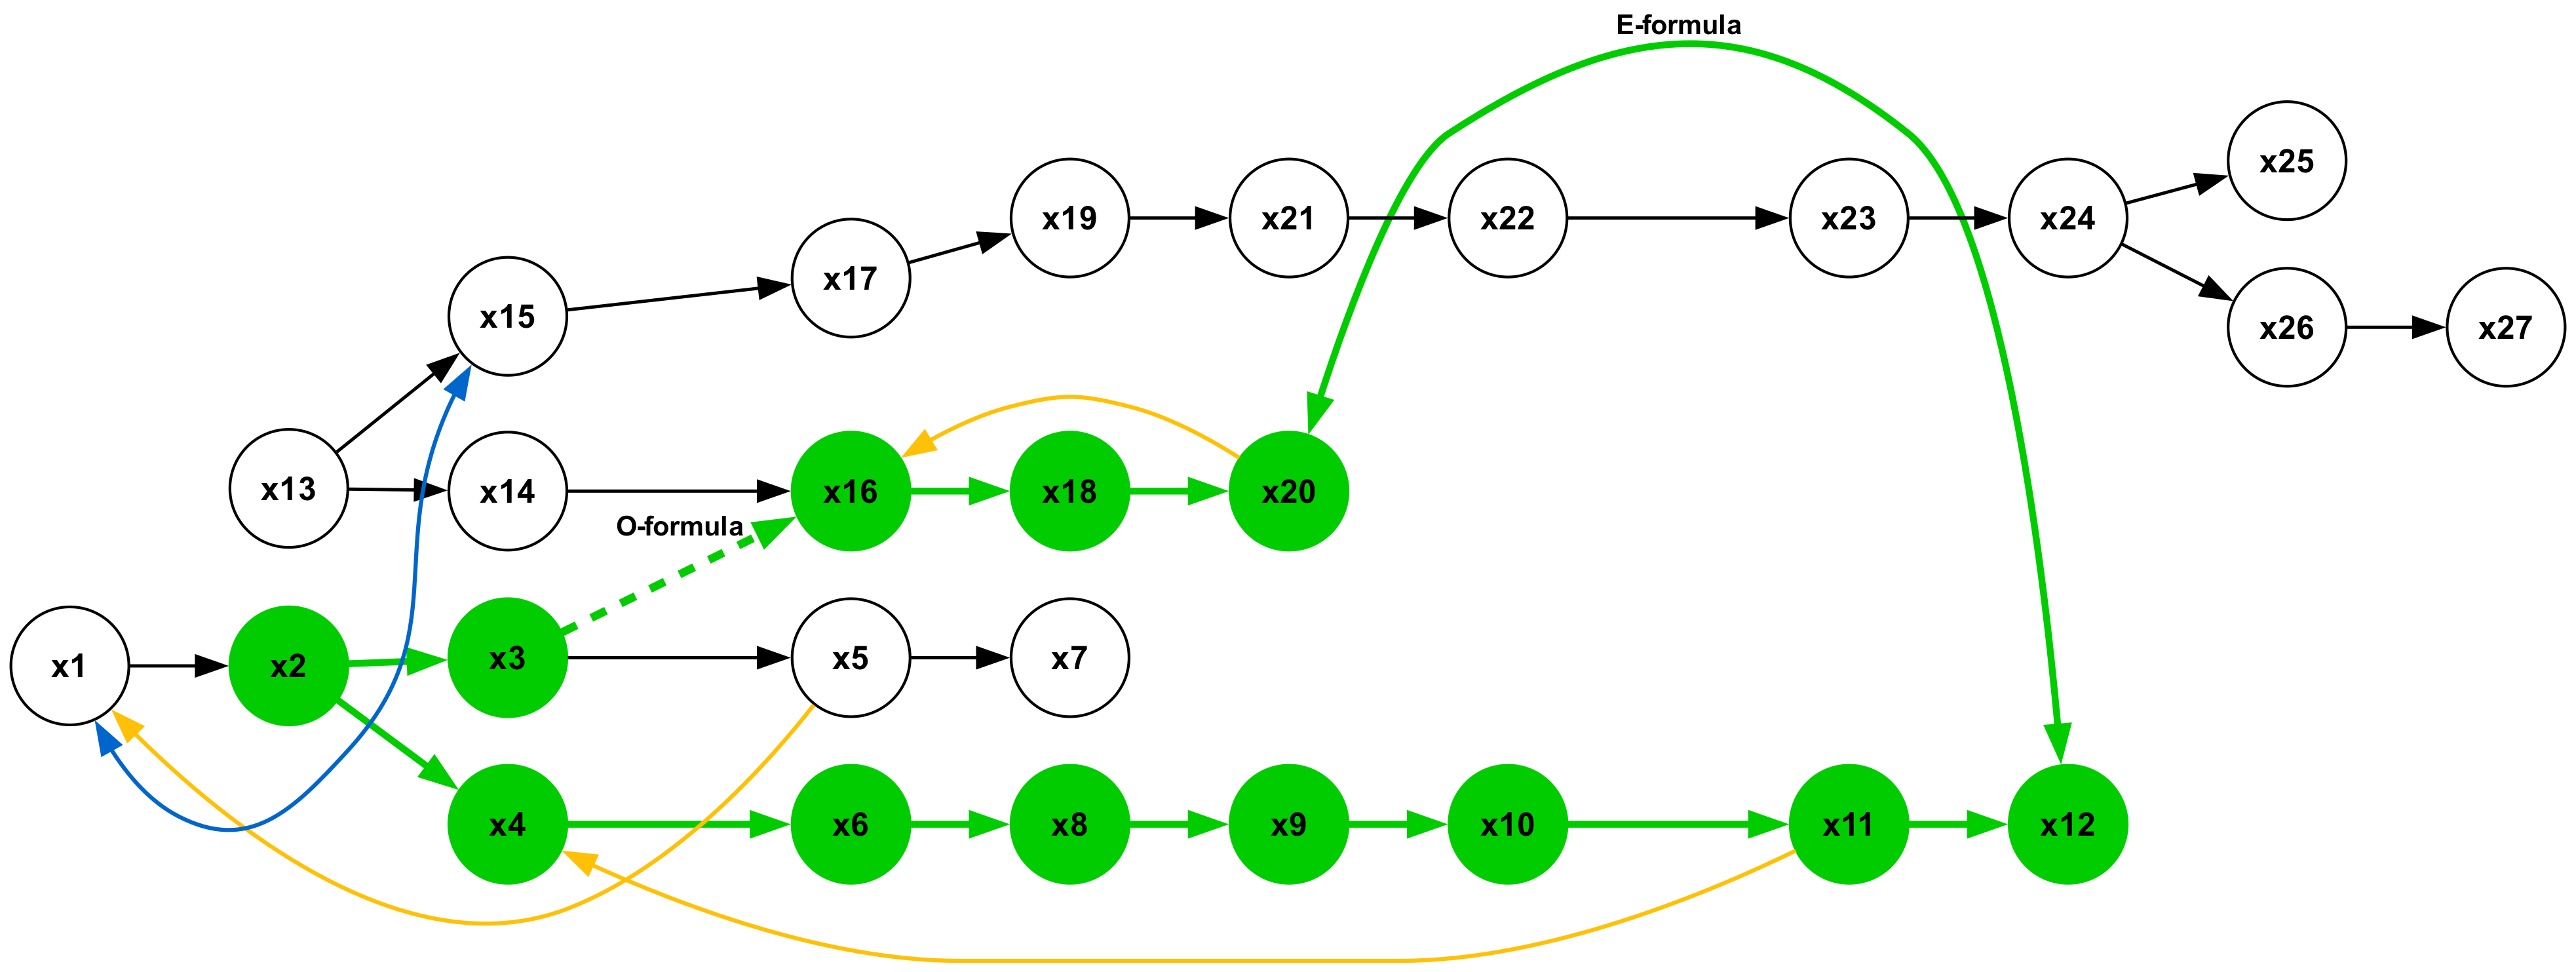
The image depicts a complex flowchart with 27 nodes (labeled `x1` to `x27`) connected by directed edges of varying colors. The diagram appears to represent a process flow with multiple pathways and conditional logic.
---
## 2. Key Components
### 2.1 Nodes
- **Labels**: All nodes are labeled sequentially from `x1` to `x27`.
- **Placement**: Nodes are arranged in a grid-like structure with:
- **Top Row**: `x19` → `x21` → `x22` → `x23` → `x24` (with branches to `x25` and `x26` → `x27`)
- **Middle Row**: `x16` → `x18` → `x20` (O-formula path)
- **Bottom Row**: `x1` → `x2` → `x3` → `x5` → `x7` (linear chain)
- **Additional Nodes**: `x4`, `x6`, `x8`, `x9`, `x10`, `x11`, `x12`, `x13`, `x14`, `x15`, `x17`
### 2.2 Edges (Arrows)
- **Colors**:
- **Black**: Primary linear pathway (e.g., `x1` → `x2`, `x5` → `x7`)
- **Green**: E-formula pathway (e.g., `x22` → `x25`, `x24` → `x26` → `x27`)
- **Yellow**: O-formula pathway (e.g., `x16` → `x18`, `x18` → `x20`)
- **Blue**: Conditional/alternate pathway (e.g., `x1` → `x2`, `x13` → `x14`)
- **Special Features**:
- Dashed yellow arrow labeled "O-formula" connects `x16` to `x14`.
- Curved green arrow labeled "E-formula" connects `x22` to `x25`.
---
## 3. Flowchart Structure
### 3.1 E-Formula Pathway (Green)
- **Primary Flow**: `x22` → `x25` → `x26` → `x27`
- **Branching**: `x24` splits to `x25` and `x26` → `x27`
- **Connectivity**: Links to `x19` (via `x21`) and `x16` (via `x18`).
### 3.2 O-Formula Pathway (Yellow)
- **Primary Flow**: `x16` → `x18` → `x20`
- **Dashed Connection**: `x16` → `x14` (labeled "O-formula")
- **Integration**: Feeds into `x17` (via `x18`) and `x19` (via `x21`).
### 3.3 Linear Chain (Black)
- **Sequence**: `x1` → `x2` → `x3` → `x5` → `x7`
- **Alternate Path**: `x1` → `x2` (blue arrow) and `x13` → `x14` (blue arrow)
### 3.4 Conditional Pathways (Blue)
- **Shortcuts**:
- `x1` → `x2` (bypasses `x3`)
- `x13` → `x14` (bypasses `x15`)
---
## 4. Spatial Grounding
- **Legend**: Not visible in the image. Colors are inferred from edge labels ("E-formula," "O-formula").
- **Node Coordinates** (approximate):
- `x1` to `x7`: Bottom-left quadrant
- `x13` to `x17`: Middle-left quadrant
- `x19` to `x27`: Top-right quadrant
---
## 5. Trend Verification
- **E-Formula Path**: Curved green arrow indicates a non-linear progression from `x22` to `x25`.
- **O-Formula Path**: Dashed yellow arrow suggests an optional or conditional branch from `x16` to `x14`.
- **Linear Chain**: Black arrows show a strict sequential flow from `x1` to `x7`.
---
## 6. Missing Information
- **Legend**: Not visible; color meanings are inferred from labels.
- **Node Labels**: All nodes are labeled, but no additional metadata (e.g., node types, weights) is provided.
- **Data Table**: No numerical data or tables present.
---
## 7. Conclusion
The flowchart represents a multi-path process with:
1. A primary linear chain (`x1` → `x7`)
2. Conditional branches (`x1` → `x2`, `x13` → `x14`)
3. E-formula and O-formula pathways with distinct color coding
4. Integration points between pathways (e.g., `x16` → `x18` → `x20`)
This structure suggests a decision-driven process with optional shortcuts and formula-based transformations.