## Scatter Plots: Monk Data Analysis
### Overview
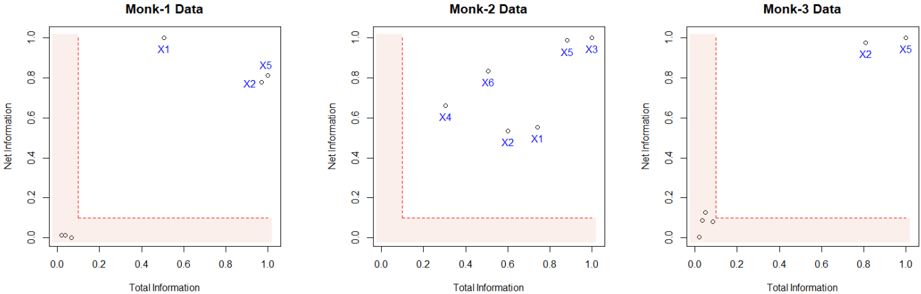
The image presents three separate scatter plots, each representing data from a different "Monk" (Monk-1, Monk-2, and Monk-3). Each plot visualizes the relationship between "Total Information" on the x-axis and "Net Information" on the y-axis. Each plot contains a shaded region, presumably representing a threshold or area of interest. Data points are labeled X1 through X6.
### Components/Axes
* **X-axis Label (all plots):** "Total Information" - Scale ranges from 0.0 to 1.0.
* **Y-axis Label (all plots):** "Net Information" - Scale ranges from 0.0 to 1.0.
* **Plot Titles:**
* Top-left: "Monk-1 Data"
* Top-center: "Monk-2 Data"
* Top-right: "Monk-3 Data"
* **Shaded Region (all plots):** A light orange, rectangular region occupying the lower-left portion of each plot. The boundaries are not precisely defined, but appear to be roughly bounded by x=0.0, y=0.0, x=0.8, and y=0.2.
* **Data Points:** Each plot contains several data points labeled X1 through X6. The color of the data points varies by plot.
### Detailed Analysis or Content Details
**Monk-1 Data (Top-Left)**
* Data points are black.
* X1: (Total Information ≈ 0.7, Net Information ≈ 0.9)
* X5: (Total Information ≈ 0.8, Net Information ≈ 0.8)
**Monk-2 Data (Top-Center)**
* Data points are blue.
* X1: (Total Information ≈ 0.5, Net Information ≈ 0.5)
* X2: (Total Information ≈ 0.7, Net Information ≈ 0.4)
* X3: (Total Information ≈ 0.9, Net Information ≈ 0.9)
* X4: (Total Information ≈ 0.4, Net Information ≈ 0.6)
* X5: (Total Information ≈ 0.9, Net Information ≈ 0.9)
* X6: (Total Information ≈ 0.6, Net Information ≈ 0.7)
**Monk-3 Data (Top-Right)**
* Data points are purple.
* X2: (Total Information ≈ 0.9, Net Information ≈ 0.9)
* X5: (Total Information ≈ 0.8, Net Information ≈ 0.9)
* Several other data points are present, clustered near the origin (Total Information < 0.4, Net Information < 0.2). Precise values are difficult to determine due to density.
### Key Observations
* **Monk-1:** Only two data points are visible, both with relatively high values for both Total and Net Information.
* **Monk-2:** Six data points are present, showing a wider distribution across the Total and Net Information scales. X3 and X5 are identical.
* **Monk-3:** A cluster of data points near the origin, and two points with high Total and Net Information.
* The shaded region in each plot appears to represent a lower bound for Total and Net Information. Most data points in Monk-2 and Monk-3 fall outside this region.
### Interpretation
The plots likely represent an attempt to quantify information processing or gain in three different individuals ("Monks"). The "Total Information" could represent the amount of information processed, while "Net Information" could represent the amount of useful information retained or the gain in knowledge.
The shaded region might represent a threshold below which information processing is considered ineffective or unreliable. The fact that Monk-1 has all data points outside the shaded region suggests that this monk consistently processes information above a certain level of effectiveness. Monk-2 and Monk-3 show more variability, with some data points falling within the shaded region, indicating periods of less effective information processing.
The identical points for X3 and X5 in Monk-2 suggest a repeated measurement or a consistent state for that monk. The clustering of points near the origin in Monk-3 could indicate a baseline level of information processing or a period of inactivity.
The differences between the monks suggest individual variations in information processing capabilities or strategies. Further analysis would be needed to determine the significance of these differences and the factors that contribute to them.