## Diagram: Process Flow with Feedback Loops
### Overview
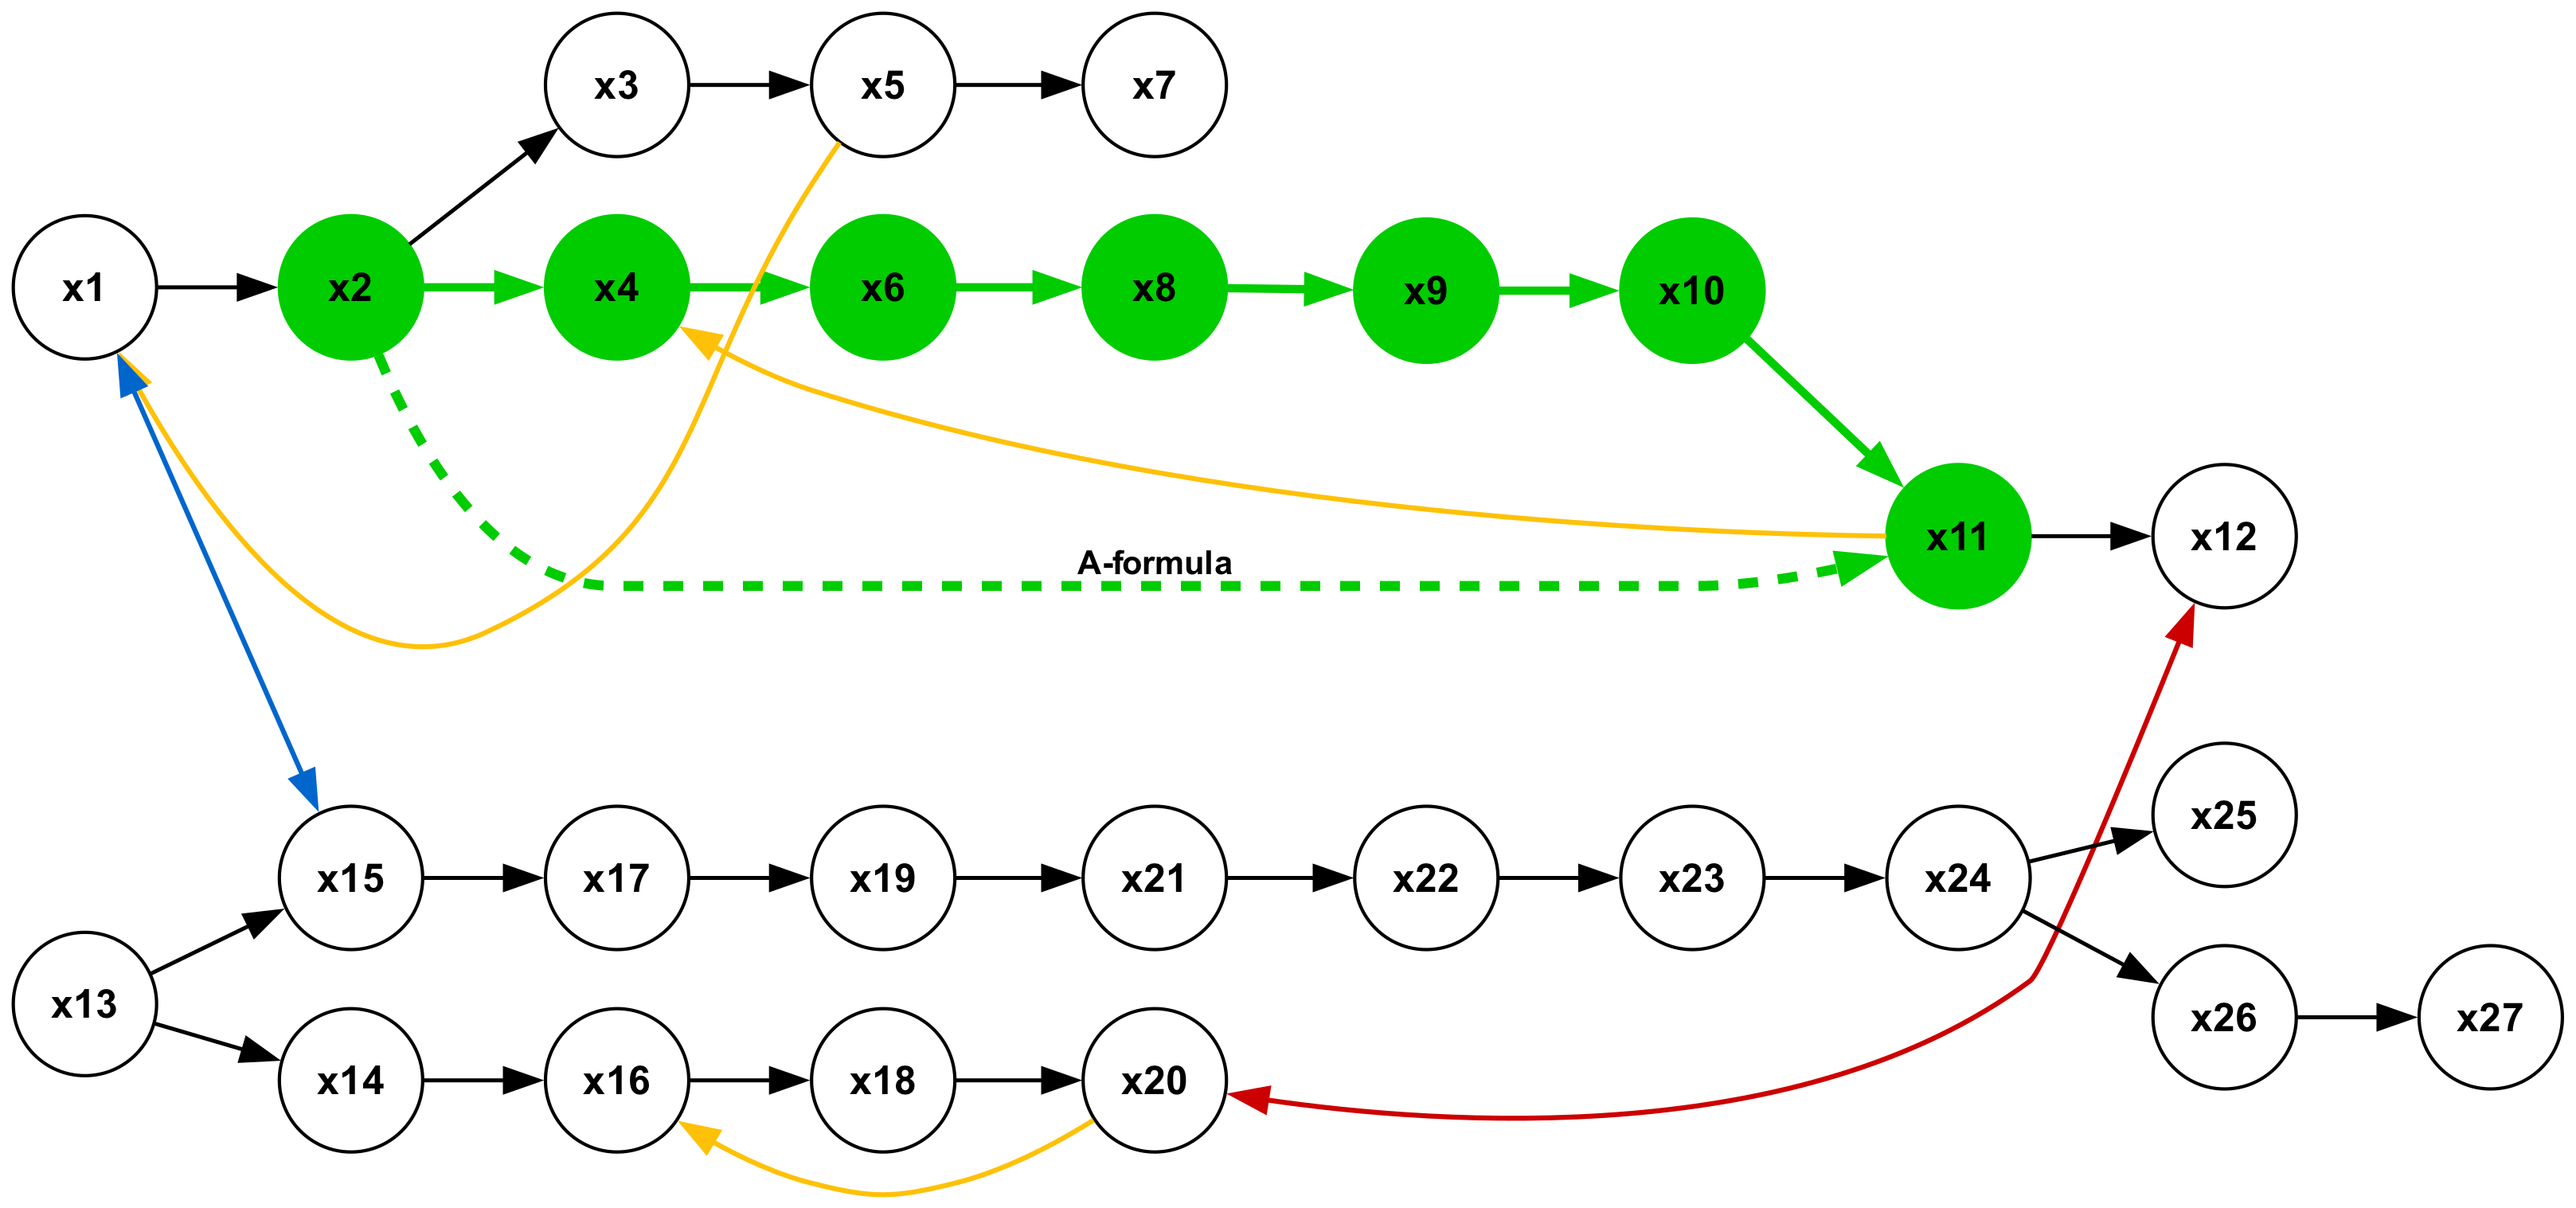
The image is a process flow diagram illustrating a sequence of steps or states, represented by circles labeled "x1" through "x27". Arrows indicate the direction of flow between these steps. The diagram includes branching paths, feedback loops (indicated by colored arrows), and a special connection labeled "A-formula". Some nodes are highlighted in green, suggesting a particular status or category.
### Components/Axes
* **Nodes:** Represented by circles, labeled x1 to x27.
* Nodes x2, x4, x6, x8, x9, x10, and x11 are filled with green color.
* All other nodes are white filled.
* **Arrows:** Indicate the direction of flow.
* Black arrows: Represent the primary flow of the process.
* Blue arrow: Represents a feedback loop from x15 to x1.
* Red arrow: Represents a feedback loop from x20 to x12.
* Yellow arrows: Represent feedback loops from x4 to x15, x6 to x11, and x16 to x18.
* Green dashed arrow: Represents a connection labeled "A-formula" from x4 to x11.
* **Text Label:** "A-formula" is associated with the green dashed arrow.
### Detailed Analysis
* **Main Flow:** The primary flow starts at x1, proceeds through x2, x4, x6, x8, x9, x10, x11, and ends at x12.
* **Branching Path 1:** From x1 to x2, a secondary path branches off from x2 to x3, x5, and x7.
* **Branching Path 2:** From x13, the flow splits into two paths: one through x15, x17, x19, x21, x22, x23, x24, x25 and the other through x14, x16, x18, x20, x26, x27.
* **Feedback Loop 1 (Blue):** A feedback loop exists from x15 back to x1.
* **Feedback Loop 2 (Red):** A feedback loop exists from x20 back to x12.
* **Feedback Loop 3 (Yellow):** A feedback loop exists from x4 to x15.
* **Feedback Loop 4 (Yellow):** A feedback loop exists from x6 to x11.
* **Feedback Loop 5 (Yellow):** A feedback loop exists from x16 to x18.
* **A-formula Connection (Green Dashed):** A connection labeled "A-formula" links x4 to x11.
### Key Observations
* The diagram illustrates a complex process with multiple branching paths and feedback loops.
* The green nodes (x2, x4, x6, x8, x9, x10, x11) likely represent key stages or states in the process.
* The "A-formula" connection suggests a specific relationship or calculation between x4 and x11.
* The feedback loops indicate iterative processes or adjustments based on the state of the system.
### Interpretation
The diagram represents a system or process with interconnected components and feedback mechanisms. The green nodes likely signify critical stages or control points within the process. The feedback loops suggest that the system is self-regulating or adaptive, with adjustments made based on the state of different components. The "A-formula" connection implies a specific calculation or relationship that influences the flow of the process. The branching paths indicate alternative routes or parallel processes within the system. The diagram could represent a variety of systems, such as a manufacturing process, a software algorithm, or a biological pathway.