\n
## Diagram: Process Flow with Node Connections
### Overview
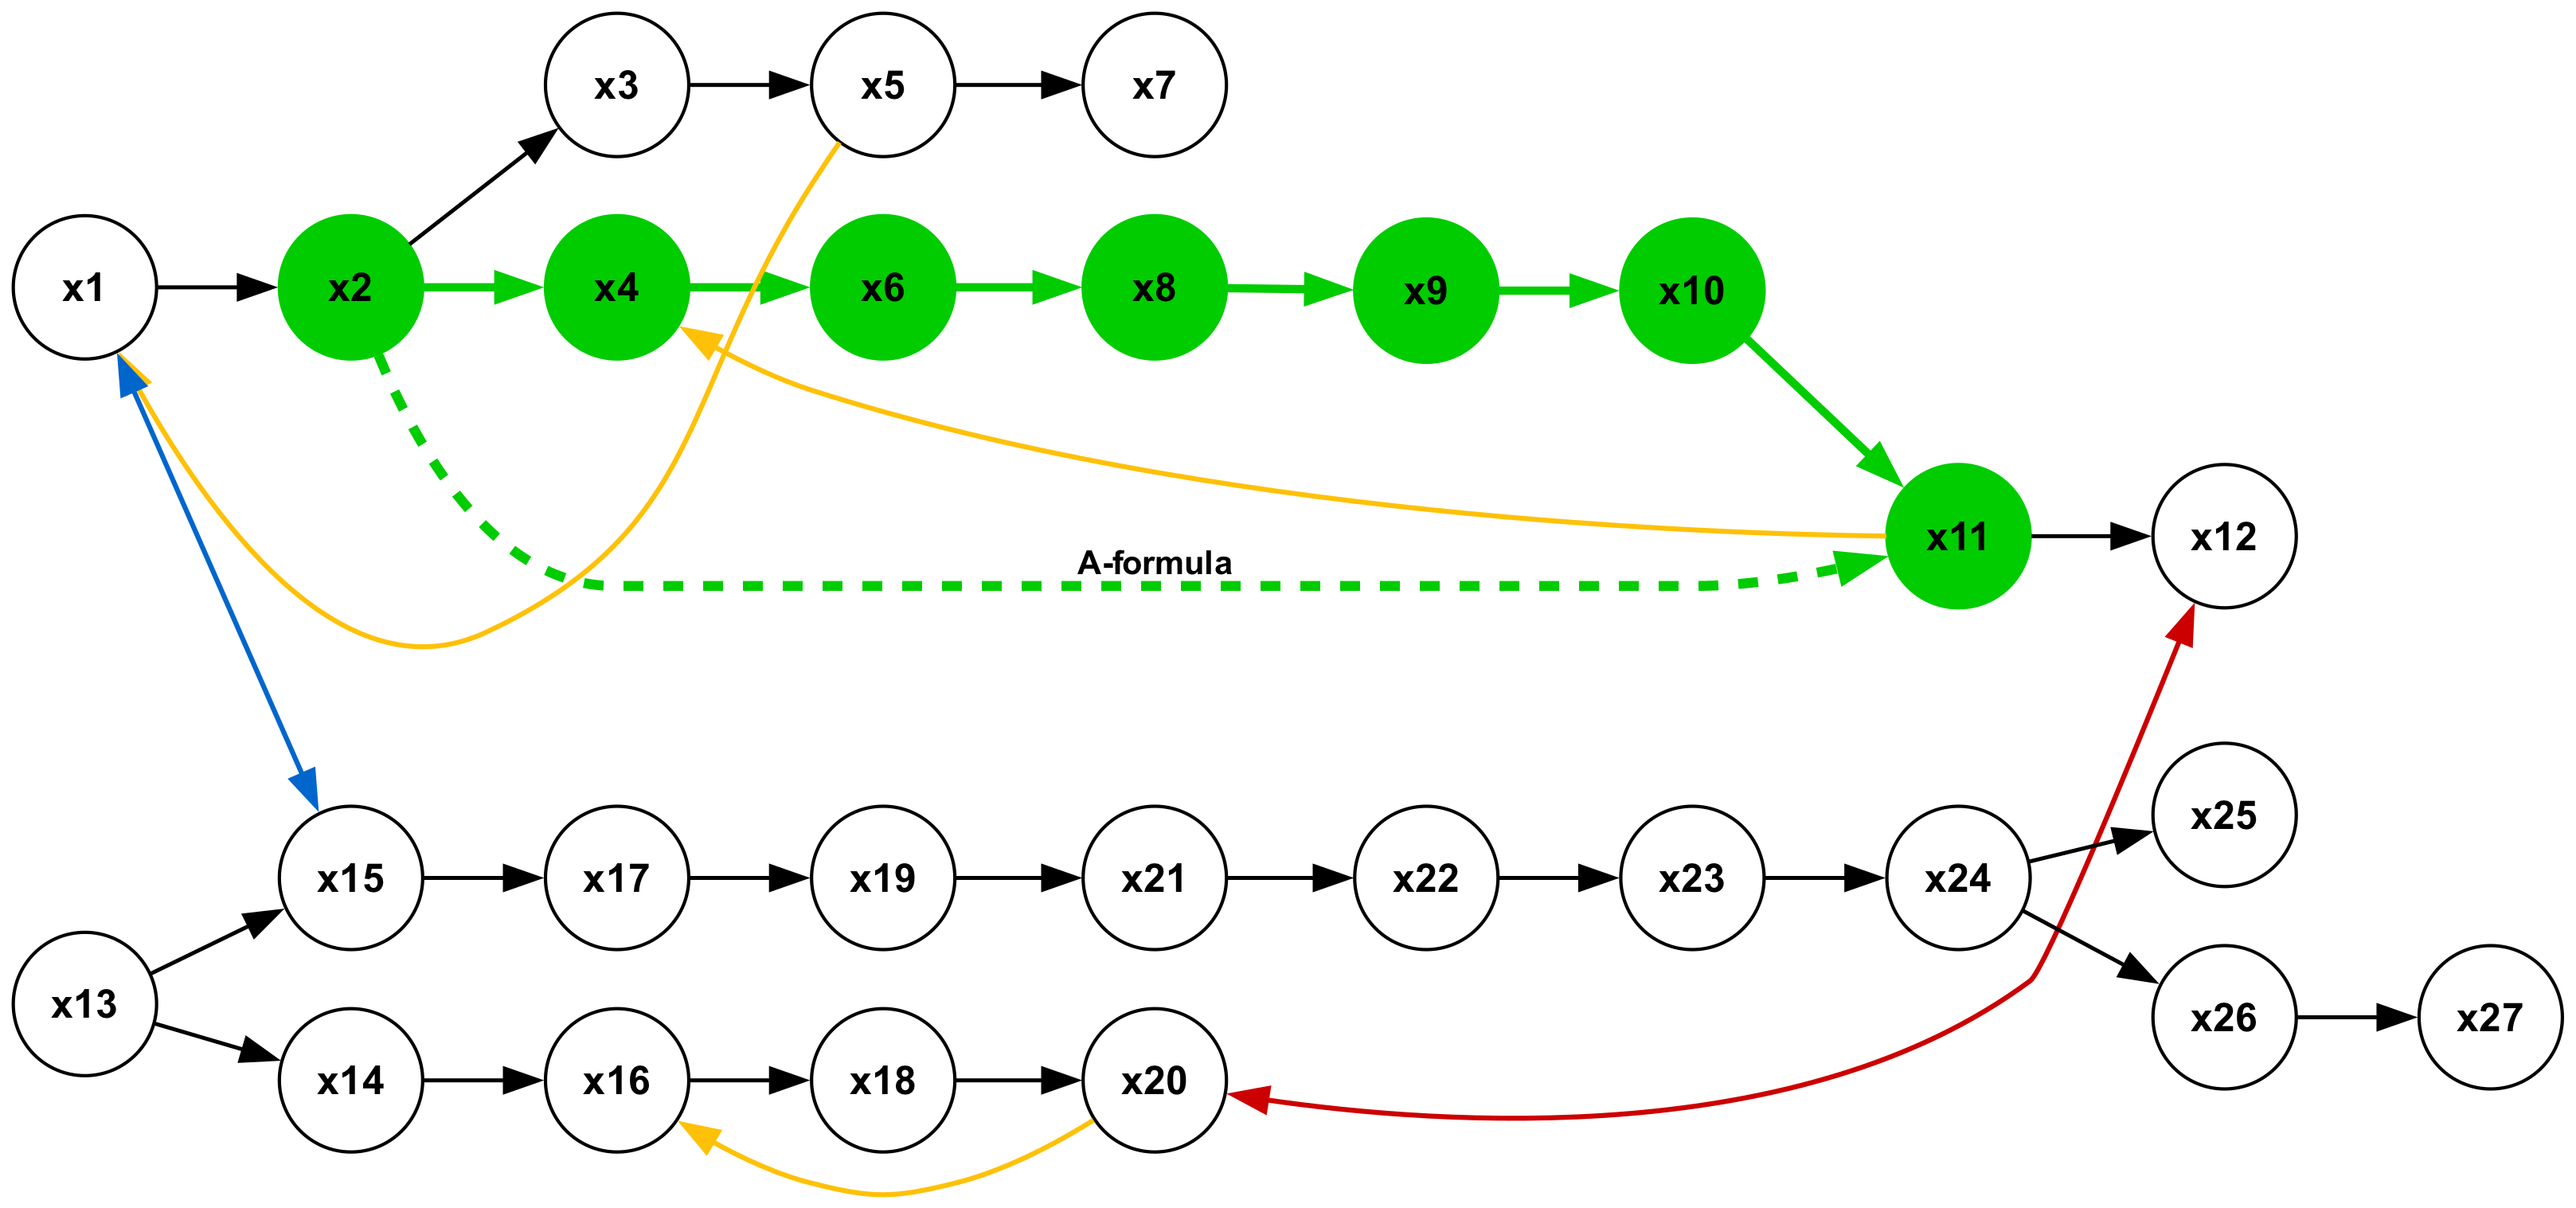
The image depicts a directed graph representing a process flow with 27 nodes (labeled x1 through x27). The nodes are interconnected by arrows indicating the direction of flow. The arrows are colored, suggesting different pathways or types of connections. A text label "A-formula" is present as a dashed green line.
### Components/Axes
The diagram consists of:
* **Nodes:** 27 circular nodes labeled x1 to x27.
* **Arrows:** Directed arrows connecting the nodes, with varying colors: blue, green, yellow, and red.
* **Text Label:** "A-formula" displayed as a dashed green line.
### Detailed Analysis or Content Details
The diagram can be segmented into two main pathways: an upper pathway and a lower pathway.
**Upper Pathway:**
* x1 (black outline) connects to x2 (green fill) via a blue arrow.
* x2 connects to x3 (green fill) via a green arrow.
* x3 connects to x4 (green fill) via a green arrow.
* x4 connects to x5 (green fill) via a green arrow.
* x5 connects to x6 (green fill) via a green arrow.
* x6 connects to x7 (green fill) via a green arrow.
* x4 connects to x8 (green fill) via a yellow arrow.
* x8 connects to x9 (green fill) via a green arrow.
* x9 connects to x10 (green fill) via a green arrow.
* x10 connects to x11 (green fill) via a green arrow.
* x2 connects to x11 (green fill) via a dashed green arrow labeled "A-formula".
* x11 connects to x12 (green fill) via a red arrow.
**Lower Pathway:**
* x1 (black outline) connects to x13 (black outline) via a blue arrow.
* x13 connects to x14 (black outline) via a black arrow.
* x14 connects to x15 (black outline) via a black arrow.
* x15 connects to x16 (black outline) via a black arrow.
* x16 connects to x17 (black outline) via a black arrow.
* x17 connects to x18 (black outline) via a black arrow.
* x18 connects to x19 (black outline) via a black arrow.
* x19 connects to x20 (black outline) via a black arrow.
* x20 connects to x21 (black outline) via a black arrow.
* x21 connects to x22 (black outline) via a black arrow.
* x22 connects to x23 (black outline) via a black arrow.
* x23 connects to x24 (black outline) via a black arrow.
* x24 connects to x25 (black outline) via a black arrow.
* x25 connects to x26 (black outline) via a black arrow.
* x26 connects to x27 (black outline) via a black arrow.
* x12 (green fill) connects to x25 (black outline) via a red arrow.
### Key Observations
* Node x1 serves as a starting point for both the upper and lower pathways.
* The upper pathway utilizes green and yellow arrows, while the lower pathway primarily uses black arrows.
* The "A-formula" connection is a direct link from x2 to x11, bypassing several nodes in the main upper pathway.
* The red arrows indicate connections between the upper and lower pathways (x11 to x12 and x12 to x25).
* The nodes x13 through x27 have black outlines, while x2 through x12 have green fills.
### Interpretation
This diagram likely represents a process or system with multiple stages and alternative routes. The different colored arrows could signify different types of operations, data flows, or dependencies. The "A-formula" connection suggests a shortcut or alternative method to reach a specific stage (x11) in the process. The convergence of the upper and lower pathways at x25 indicates a point of integration or synchronization. The diagram suggests a system where a starting point (x1) can lead to different outcomes depending on the path taken. The use of green fill for nodes x2-x12 could indicate a "successful" or "active" state, while the black outline for x13-x27 could represent a different state or a subsequent stage in the process. The red arrows suggest a feedback loop or a critical connection between the two main pathways. The diagram is a high-level representation and lacks quantitative data, but it provides a clear visual overview of the process flow and its key components.