## Directed Graph Diagram: System Flowchart with Conditional Paths
### Overview
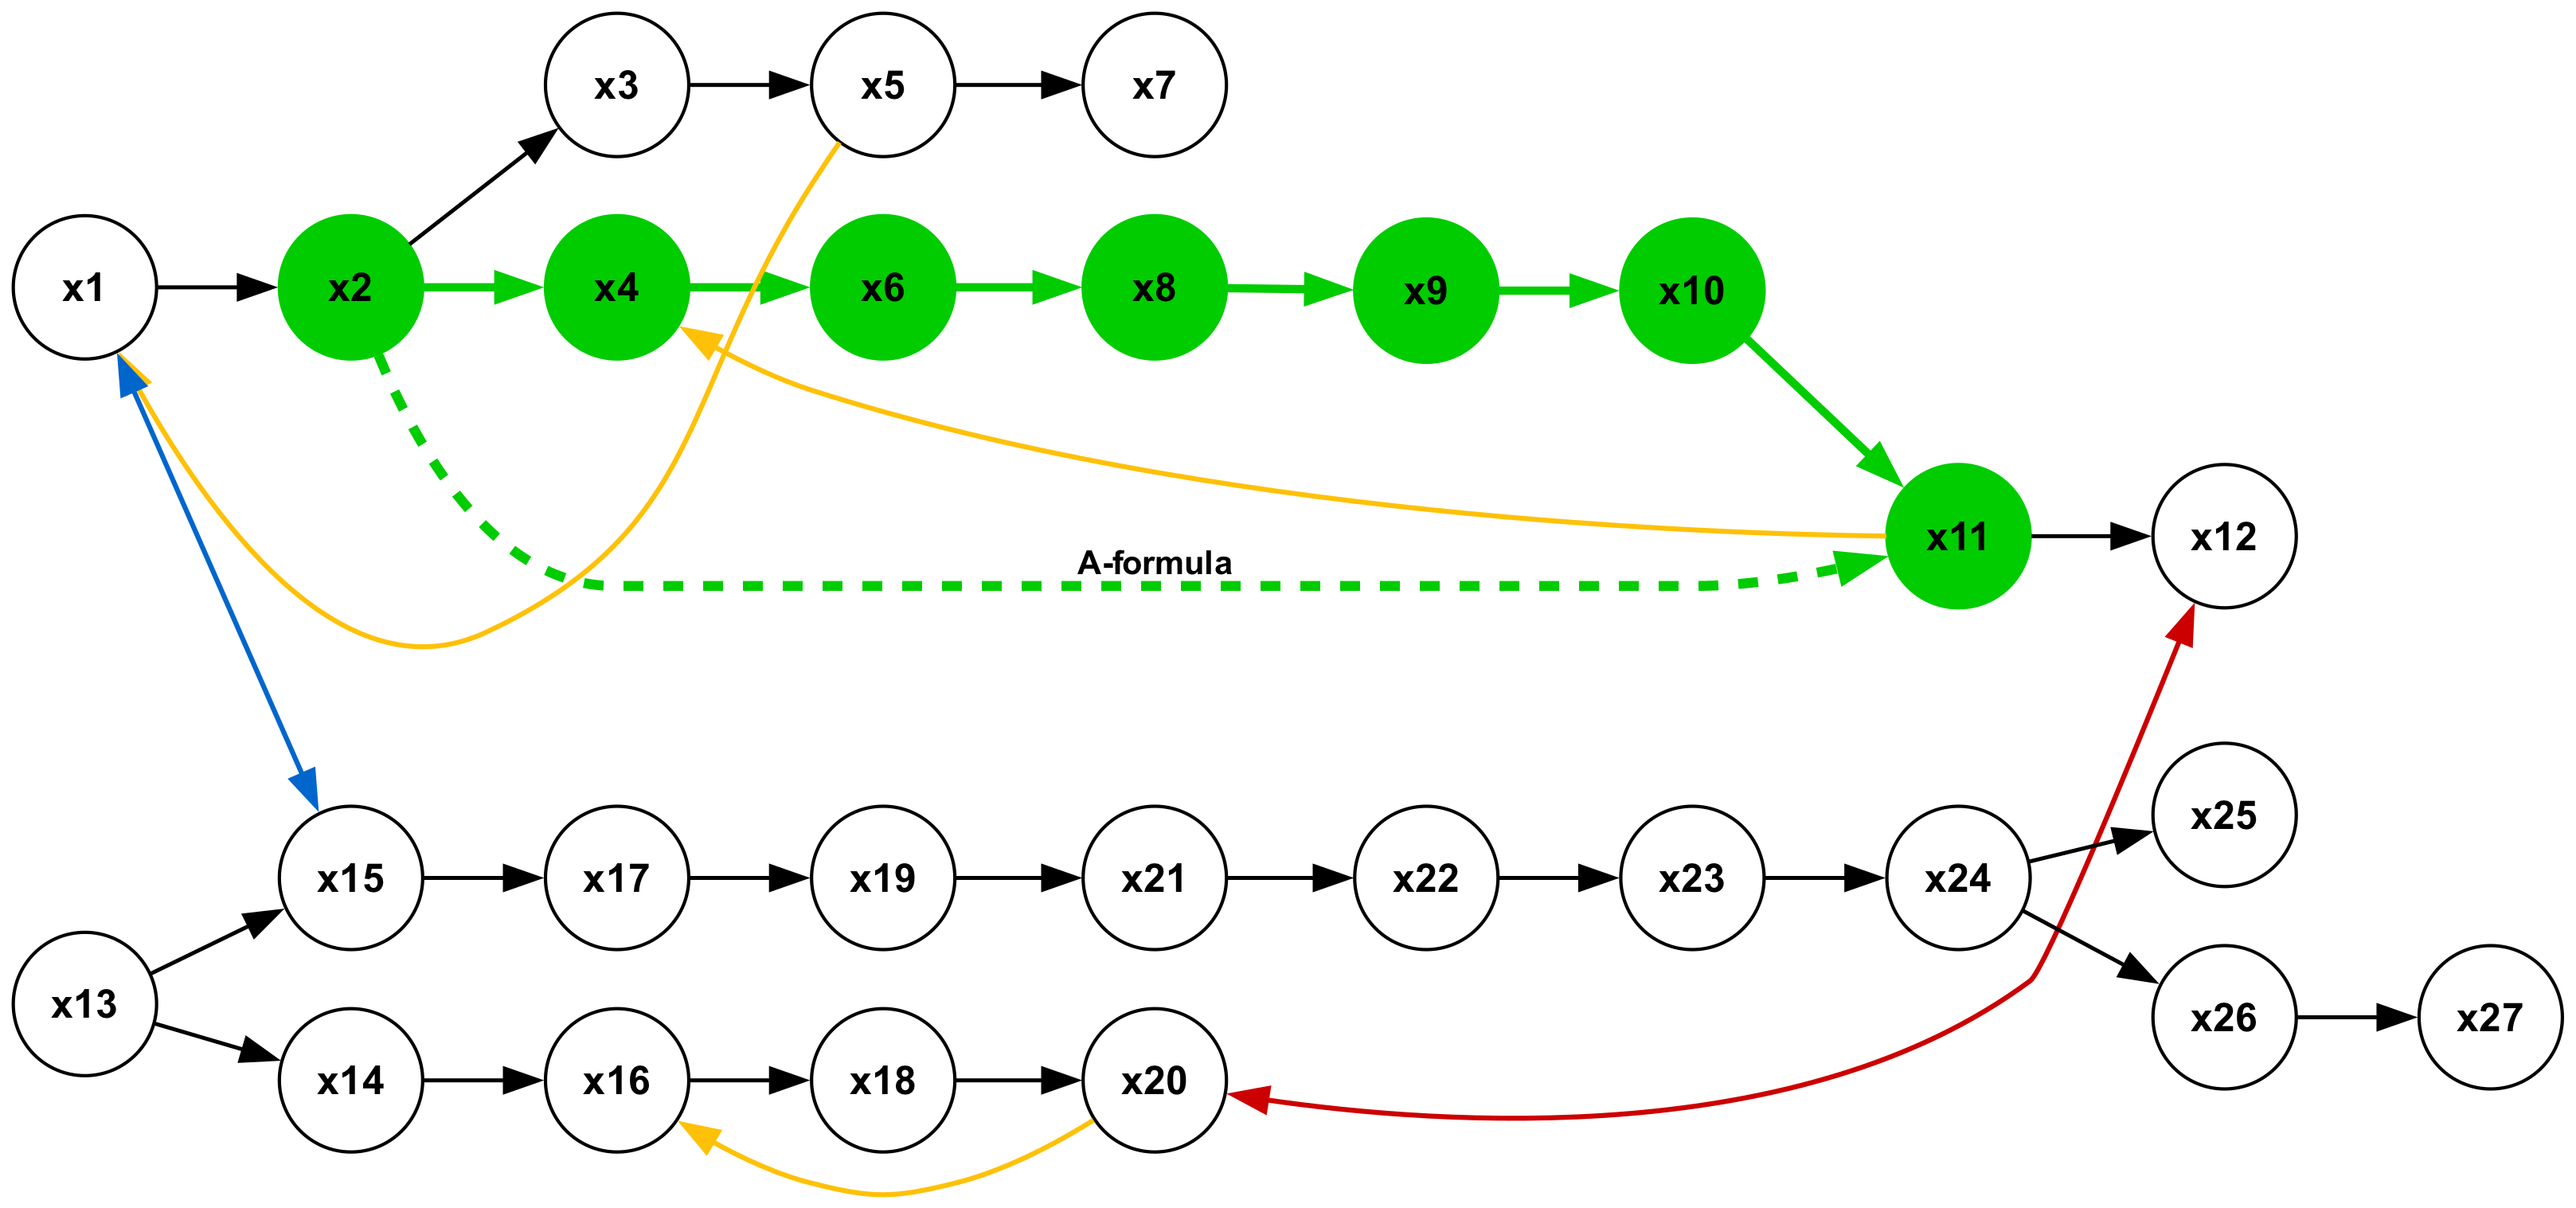
The image displays a directed graph (flowchart) consisting of 27 nodes labeled `x1` through `x27`. The nodes are arranged in two primary horizontal sequences with multiple interconnecting paths. The diagram uses color-coding for nodes (green-filled vs. white-filled) and arrows (black, green, yellow, blue, red, dashed) to denote different types of relationships or flows within the system. A single text label, "A-formula," is present on a specific dashed arrow.
### Components/Axes
* **Nodes**: 27 circular nodes, each labeled with an identifier from `x1` to `x27`.
* **Green-filled nodes**: `x2`, `x4`, `x6`, `x8`, `x9`, `x10`, `x11`. These form a contiguous chain in the upper sequence.
* **White-filled nodes**: All other nodes (`x1`, `x3`, `x5`, `x7`, `x12` through `x27`).
* **Edges (Arrows)**: Directed arrows connecting nodes, differentiated by color and style:
* **Solid Black Arrows**: The most common connection type, indicating a standard flow or dependency.
* **Solid Green Arrows**: Connect the green nodes in sequence (`x2`→`x4`→`x6`→`x8`→`x9`→`x10`→`x11`).
* **Dashed Green Arrow**: Connects `x2` directly to `x11`. This arrow is labeled with the text **"A-formula"**.
* **Yellow Arrows**: Three instances: `x5`→`x4`, `x11`→`x4`, and `x20`→`x16`.
* **Blue Arrows**: Two instances: `x1`→`x15` and `x13`→`x15`.
* **Red Arrows**: Two instances: `x24`→`x12` and `x24`→`x20`.
* **Spatial Layout**:
* **Upper Sequence**: Runs horizontally from left (`x1`) to right (`x12`). The green nodes form the central spine of this sequence.
* **Lower Sequence**: Starts at `x13` (left) and splits into two parallel horizontal branches:
* **Upper Branch**: `x15` → `x17` → `x19` → `x21` → `x22` → `x23` → `x24`.
* **Lower Branch**: `x14` → `x16` → `x18` → `x20`.
* **Cross-Connections**: Several arrows bridge the upper and lower sequences (e.g., `x1`→`x15`, `x13`→`x15`, `x24`→`x12`, `x24`→`x20`).
### Detailed Analysis
**Node Connectivity and Flow Paths:**
1. **Primary Green Path (Upper Sequence)**:
* Flow: `x2` → `x4` → `x6` → `x8` → `x9` → `x10` → `x11`.
* This is a linear, forward-moving chain highlighted in green.
* **Special Connection**: A dashed green arrow labeled **"A-formula"** creates a direct link from `x2` to `x11`, bypassing the intermediate nodes `x4`, `x6`, `x8`, `x9`, `x10`.
2. **Upper Sequence Branches and Loops**:
* `x1` feeds into the green path at `x2`.
* `x3` → `x5` → `x7` is a separate, short branch off the main flow.
* **Feedback/Loop Arrows (Yellow)**:
* `x5` → `x4`: Connects the short branch back into the green path.
* `x11` → `x4`: Creates a loop from the end of the green path back to an earlier node (`x4`).
* The green path terminates at `x11`, which then connects to `x12`.
3. **Lower Sequence Structure**:
* `x13` is the root, splitting into two branches.
* **Upper Branch**: A linear chain from `x15` to `x24`.
* **Lower Branch**: A linear chain from `x14` to `x20`.
* **Internal Loop (Yellow)**: `x20` → `x16` creates a loop within the lower branch.
* **Termination**: `x24` splits, feeding into `x25` and `x26`→`x27`.
4. **Cross-Sequence Connections**:
* **Blue Arrows**: `x1` (upper) → `x15` (lower) and `x13` (lower) → `x15` (lower). This indicates `x15` receives input from both the start of the upper sequence and the start of the lower sequence.
* **Red Arrows**: `x24` (lower) → `x12` (upper) and `x24` (lower) → `x20` (lower). This shows the lower sequence's endpoint (`x24`) feeds back into the upper sequence's endpoint (`x12`) and also back into its own lower branch (`x20`).
### Key Observations
1. **Highlighted Process**: The green nodes and arrows (`x2` through `x11`) clearly denote a primary, emphasized process or critical path within the system.
2. **Formulaic Shortcut**: The "A-formula" dashed arrow represents an alternative, possibly optimized or rule-based, transition that skips several steps in the primary green path.
3. **Cyclic Dependencies**: The diagram contains multiple feedback loops (yellow arrows: `x11`→`x4`, `x5`→`x4`, `x20`→`x16`), suggesting iterative processes or state revisitation.
4. **Integration Points**: Nodes `x15` and `x24` act as major integration hubs. `x15` merges inputs from two different origins (`x1`, `x13`). `x24` distributes its output to three different destinations (`x12`, `x25`, `x26`), including a cross-sequence connection.
5. **Asymmetric Flow**: While the overall flow is left-to-right, the numerous backward-pointing arrows (yellow, red) create a complex web of dependencies rather than a simple linear progression.
### Interpretation
This diagram likely models a **complex system with parallel processes, conditional logic, and feedback mechanisms**. It could represent:
* A **computational workflow** where green nodes are core operations, "A-formula" is a mathematical shortcut, and colored arrows denote different data types or control signals.
* A **state machine** for a software system, where nodes are states and arrows are transitions. The green path might be the "happy path" or main execution thread.
* A **dependency graph** for a project or algorithm, showing task prerequisites. The loops indicate tasks that may need re-execution.
The **"A-formula"** is the most significant interpretive clue. It suggests that the relationship between `x2` and `x11` is governed by a specific rule or equation that allows for a direct transition, potentially bypassing intermediate calculations or steps represented by `x4` through `x10`. The presence of multiple feedback loops (yellow arrows) indicates the system is not purely feed-forward; it contains cycles where outputs can influence earlier stages, characteristic of control systems, iterative algorithms, or processes with revision steps.
The cross-connections via blue and red arrows show that the two main sequences are not independent; they interact at key points (`x15`, `x12`, `x20`), implying a higher-level coordination or data exchange between what might be two subsystems or modules.