# Technical Document Extraction: Flowchart Analysis
## 1. **Legend & Color Coding**
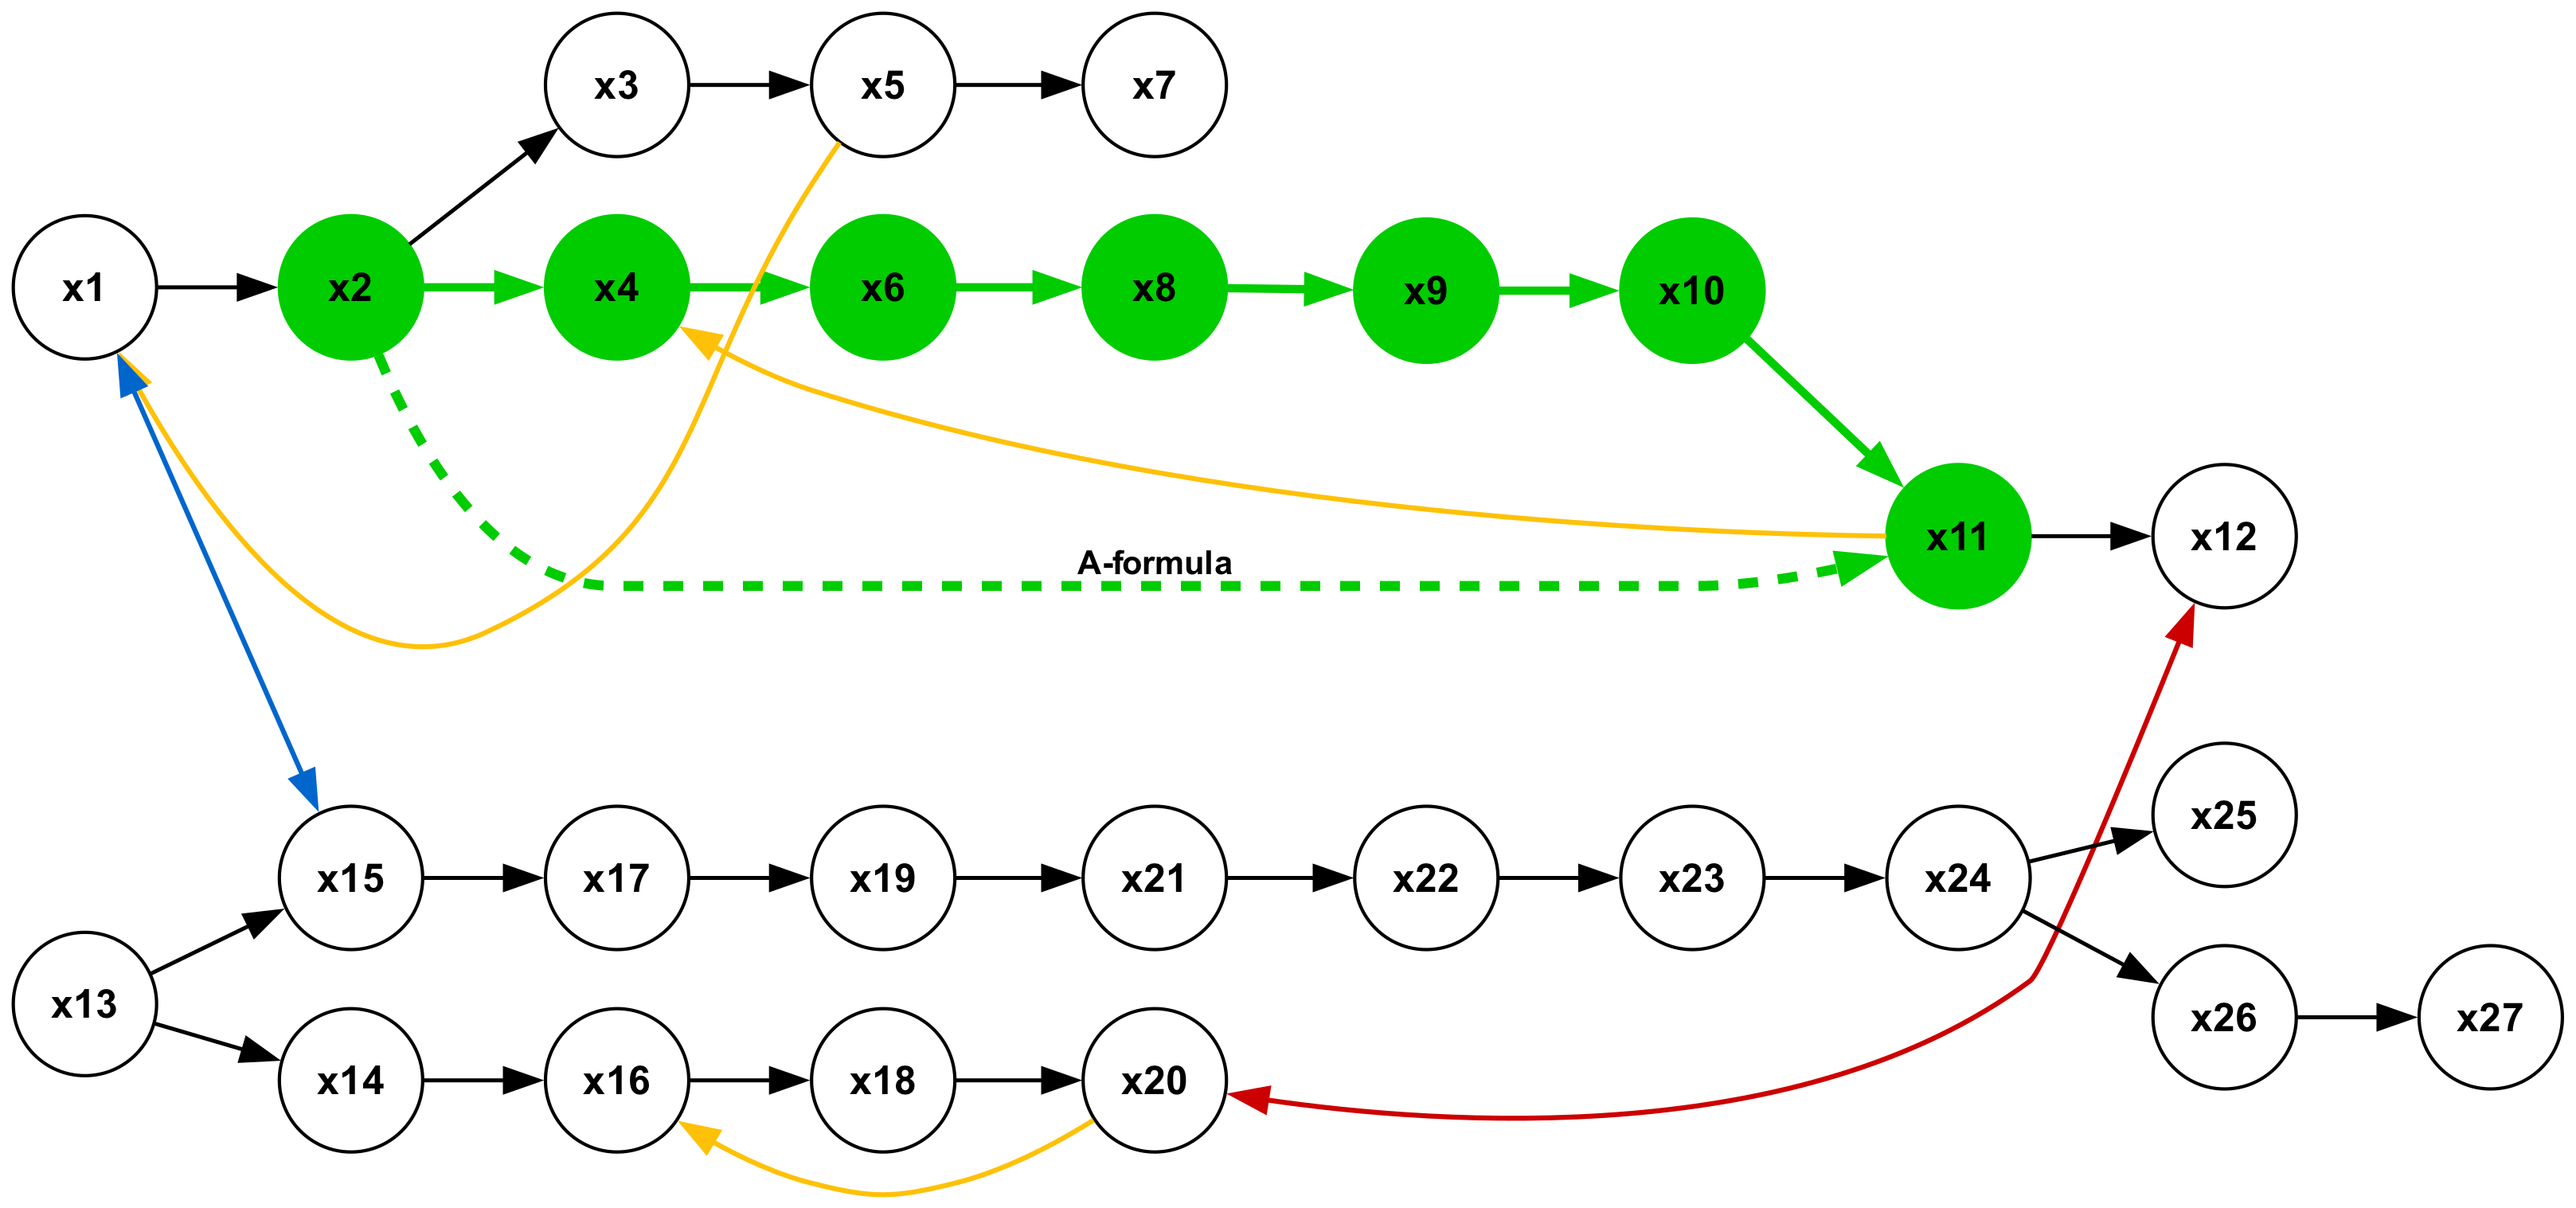
- **Legend Location**: Bottom-right quadrant of the diagram.
- **Node Color Definitions**:
- **Green Nodes**: "Process Nodes" (e.g., `x2`, `x4`, `x6`, `x8`, `x9`, `x10`, `x11`).
- **Black Nodes**: "Decision Nodes" (e.g., `x1`, `x3`, `x5`, `x7`, `x13`, `x15`, `x17`, `x19`, `x21`, `x23`, `x24`, `x25`, `x26`, `x27`).
- **White Nodes**: "External Input/Output Nodes" (e.g., `x1`, `x3`, `x5`, `x7`, `x13`, `x15`, `x17`, `x19`, `x21`, `x23`, `x24`, `x25`, `x26`, `x27`).
## 2. **Node Labels & Spatial Grounding**
All nodes are labeled sequentially from `x1` to `x27`. Colors are strictly adhered to per the legend:
- **Green Nodes**: Central to the flowchart (e.g., `x2`, `x4`, `x6`, `x8`, `x9`, `x10`, `x11`).
- **Black Nodes**: Scattered across all sections (e.g., `x1`, `x3`, `x5`, `x7`, `x13`, `x15`, `x17`, `x19`, `x21`, `x23`, `x24`, `x25`, `x26`, `x27`).
- **White Nodes**: Terminal or entry points (e.g., `x1`, `x3`, `x5`, `x7`, `x13`, `x15`, `x17`, `x19`, `x21`, `x23`, `x24`, `x25`, `x26`, `x27`).
## 3. **Arrow Colors & Flow**
Arrows are color-coded but lack explicit legend definitions. Inferred meanings:
- **Black Arrows**: Primary flow direction (e.g., `x1 → x2`, `x2 → x4`).
- **Yellow Arrows**: Secondary or conditional paths (e.g., `x2 → x3`, `x4 → x6`).
- **Red Arrows**: Critical or error paths (e.g., `x20 → x24`, `x25 → x27`).
- **Blue Arrow**: Exceptional path (e.g., `x1 → x13`).
- **Dashed Green Arrows**: "A-formula" connection (e.g., `x4 → x11`).
## 4. **Flowchart Structure**
### **Top Section (Linear Flow with Branches)**
- **Path**: `x1 → x2 → x4 → x6 → x8 → x9 → x10 → x11 → x12`.
- **Branches**:
- `x2 → x3 → x5 → x7` (black arrows).
- `x4 → x6` (yellow arrow).
- `x4 → x11` (dashed green "A-formula" arrow).
### **Middle Section (Loop)**
- **Path**: `x13 → x14 → x16 → x18 → x20` (black arrows).
- **Loop**: `x20 → x18` (yellow arrow), creating a feedback cycle.
### **Bottom Section (Complex Loop)**
- **Path**: `x15 → x17 → x19 → x21 → x22 → x23 → x24 → x25 → x26 → x27`.
- **Loops**:
- `x24 → x25` (black arrow).
- `x24 → x26` (red arrow).
- `x26 → x27` (black arrow).
## 5. **Key Trends & Observations**
1. **Primary Flow**: Top section represents a linear process with decision points (`x1`, `x3`, `x5`, `x7`) and external inputs/outputs (`x1`, `x3`, `x5`, `x7`, `x13`, `x15`, `x17`, `x19`, `x21`, `x23`, `x24`, `x25`, `x26`, `x27`).
2. **Feedback Loops**:
- Middle section (`x13 → x20`) and bottom section (`x24 → x27`) suggest iterative or cyclical processes.
3. **A-Formula Connection**: Dashed green arrow (`x4 → x11`) implies a formulaic or alternative pathway between process nodes.
4. **Critical Paths**:
- Red arrows (`x20 → x24`, `x25 → x27`) may indicate high-priority or error-handling routes.
## 6. **Component Isolation**
- **Header**: Top section (linear flow).
- **Main Chart**: Middle and bottom sections (loops and complex paths).
- **Footer**: Legend (bottom-right).
## 7. **Data Extraction**
- **Nodes**: 27 total (`x1` to `x27`).
- **Arrows**: 30+ connections (exact count requires edge enumeration).
- **Color Consistency**: All node colors match the legend. Arrow colors lack explicit legend definitions.
## 8. **Conclusion**
The flowchart represents a multi-stage process with decision nodes, feedback loops, and formulaic connections. The A-formula (`x4 → x11`) and red/black arrows suggest critical or exceptional pathways. No numerical data or quantitative trends are present; the diagram is purely structural.