## Bar Chart: Tool Performance
### Overview
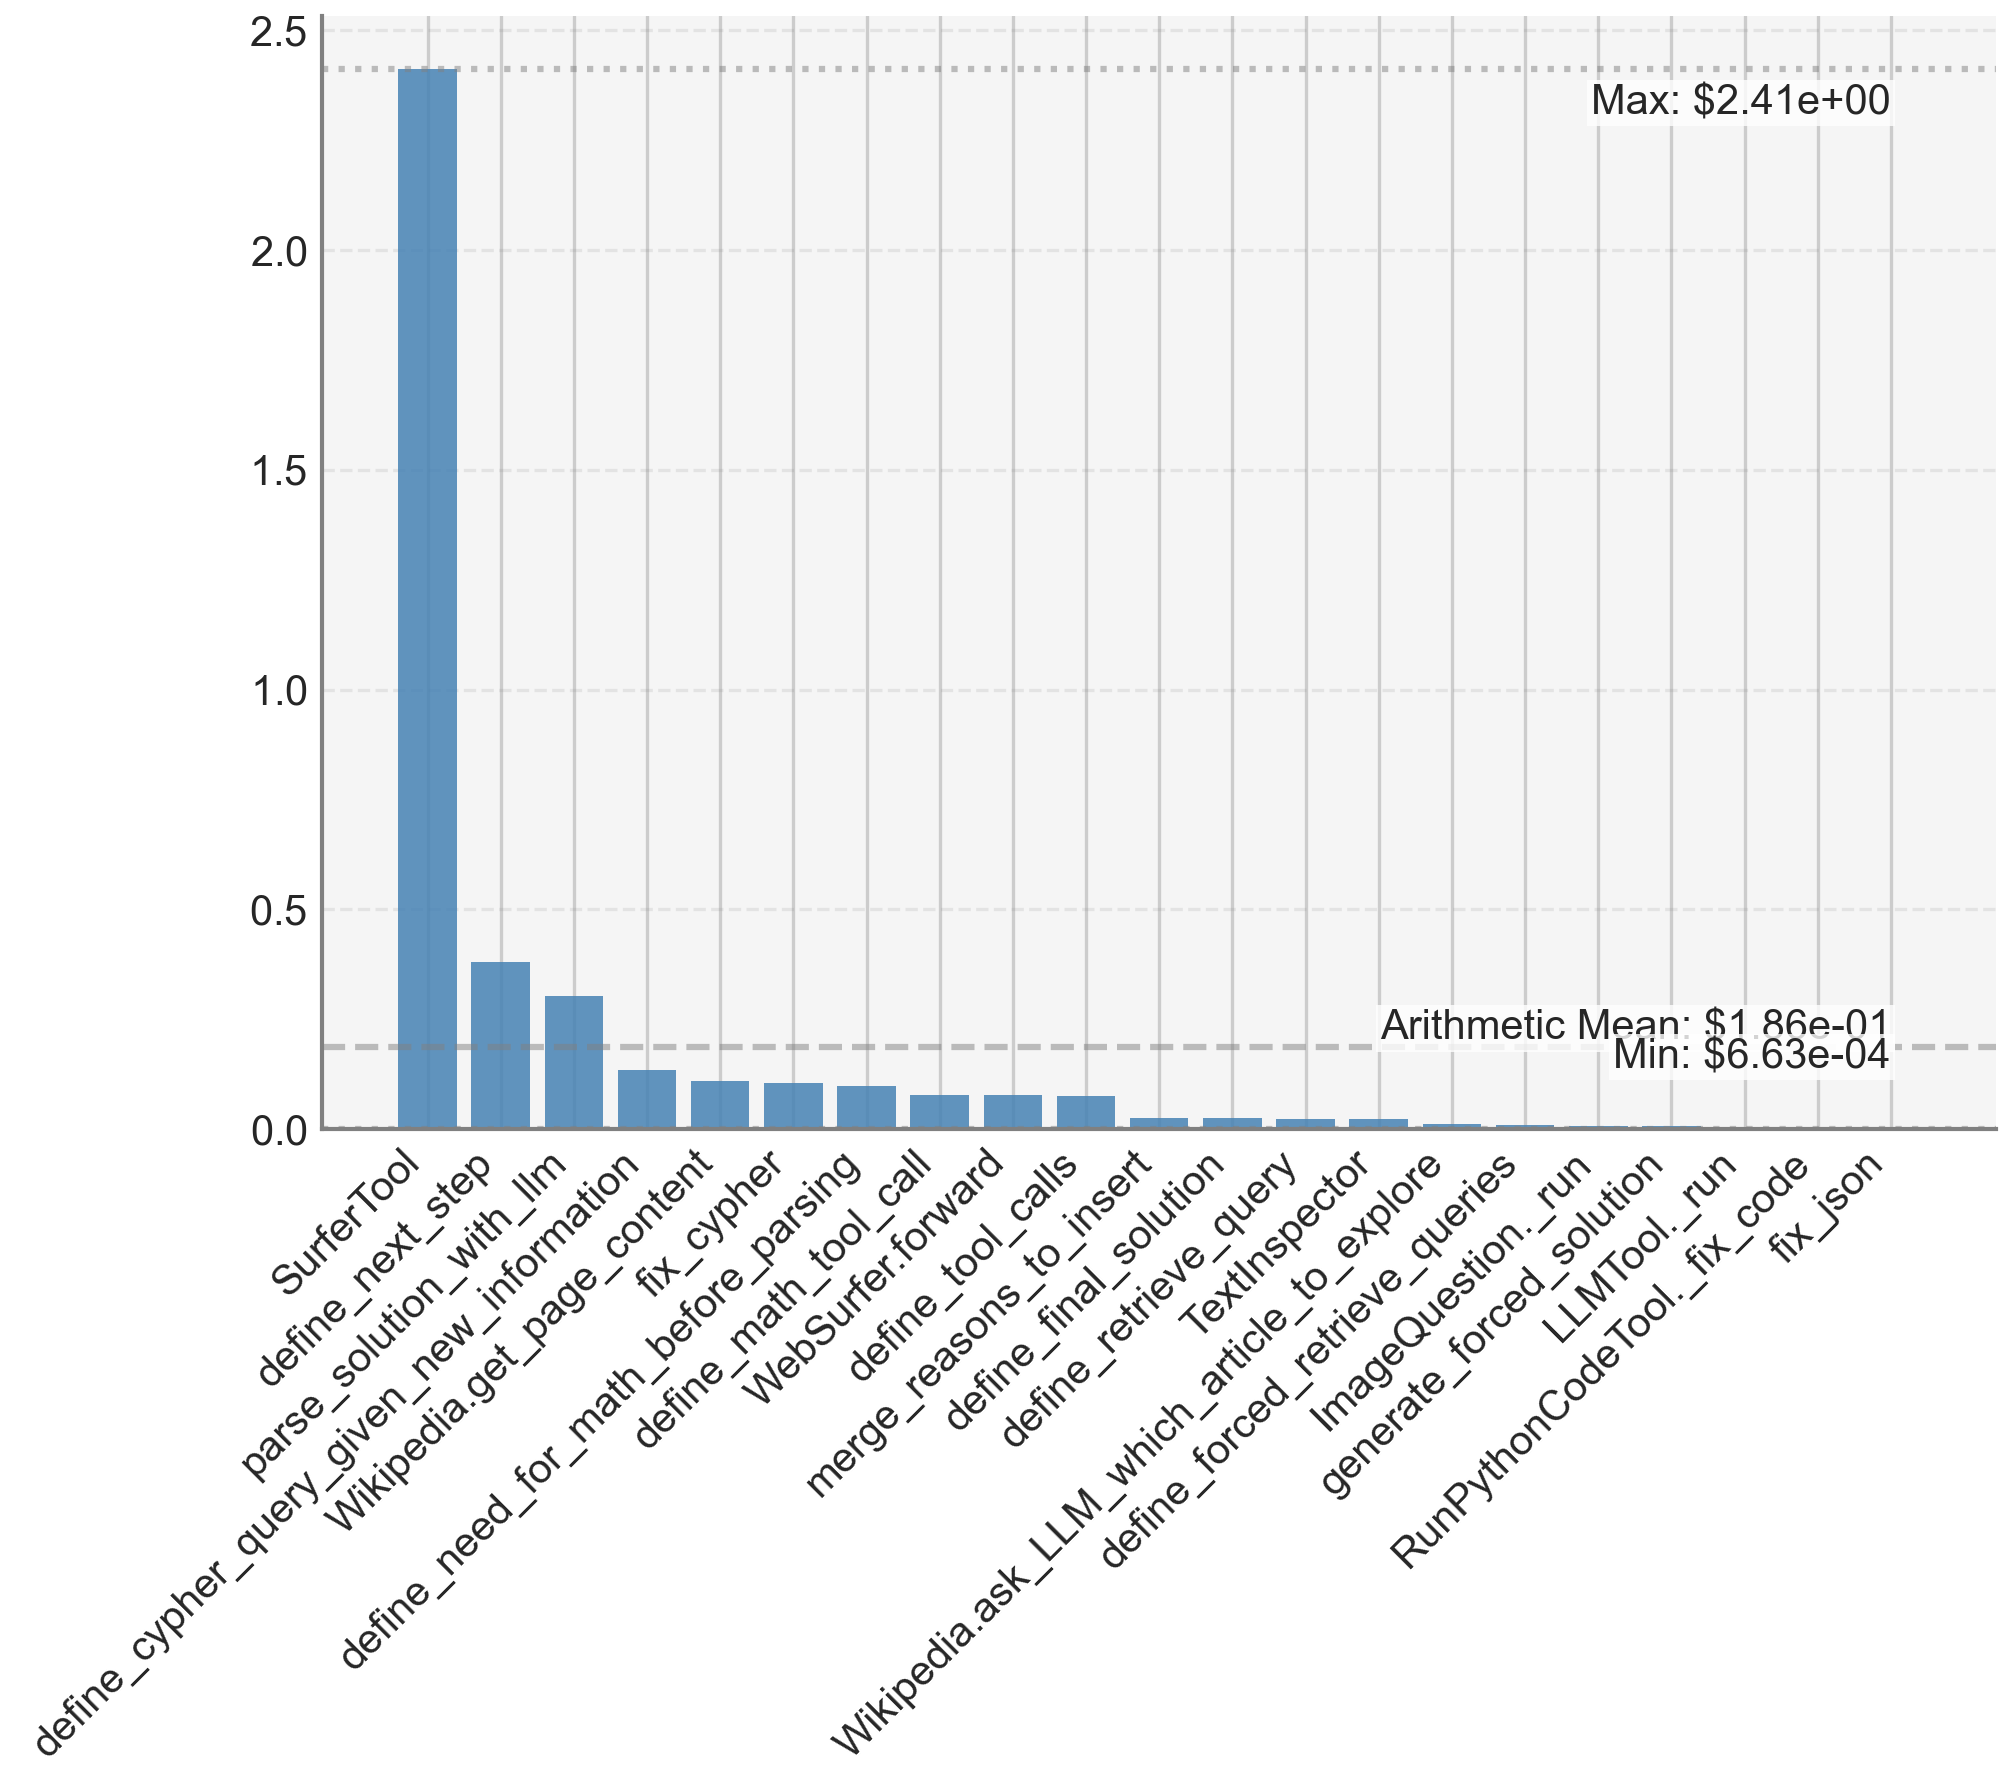
The image is a bar chart displaying the performance of various tools. The y-axis represents a numerical value, and the x-axis lists the names of the tools. The chart also includes horizontal lines indicating the arithmetic mean, minimum, and maximum values.
### Components/Axes
* **X-axis:** Tool names (listed below)
* **Y-axis:** Numerical value, ranging from 0.0 to 2.5, with increments of 0.5.
* **Bars:** Blue bars representing the performance value for each tool.
* **Horizontal Lines:**
* Dotted line at approximately 2.4, labeled "Max: $2.41e+00"
* Dashed line at approximately 0.18, labeled "Arithmetic Mean: $1.86e-01"
* Dashed line at approximately 0.0006, labeled "Min: $6.63e-04"
### Detailed Analysis
The following is a list of the tools and their approximate values, extracted from the bar chart.
* **SurferTool:** ~2.4
* **define\_next\_step:** ~0.38
* **parse\_solution\_with\_llm:** ~0.3
* **Wikipedia.get\_page\_content:** ~0.14
* **define\_cypher\_query\_given\_new\_information:** ~0.13
* **fix\_cypher:** ~0.12
* **define\_need\_for\_math\_before\_parsing:** ~0.1
* **define\_math\_tool\_call:** ~0.09
* **WebSurfer.forward:** ~0.09
* **merge\_reasons\_to\_insert:** ~0.08
* **define\_tool\_calls:** ~0.08
* **define\_final\_solution:** ~0.07
* **define\_retrieve\_query:** ~0.02
* **Wikipedia.ask\_LLM\_which\_article\_to\_explore:** ~0.01
* **TextInspector:** ~0.01
* **define\_forced\_retrieve\_queries:** ~0.01
* **ImageQuestion.\_run:** ~0.01
* **generate\_forced\_solution:** ~0.005
* **LLMTool.\_run:** ~0.005
* **RunPythonCodeTool.\_fix\_code:** ~0.005
* **fix\_json:** ~0.005
### Key Observations
* **SurferTool** has a significantly higher value than all other tools.
* Most tools have relatively low values, clustered near the bottom of the chart.
* The arithmetic mean is significantly higher than the minimum value, indicating a skewed distribution.
### Interpretation
The bar chart illustrates the relative performance of different tools. The SurferTool appears to be the most effective or frequently used, as indicated by its high value. The other tools have considerably lower values, suggesting they are either less effective, less frequently used, or have a different scale of measurement. The arithmetic mean provides a sense of the average performance, while the minimum and maximum values highlight the range of performance across all tools. The skewed distribution suggests that a few tools perform significantly better than the majority.