\n
## Bar Chart: Tool Execution Times
### Overview
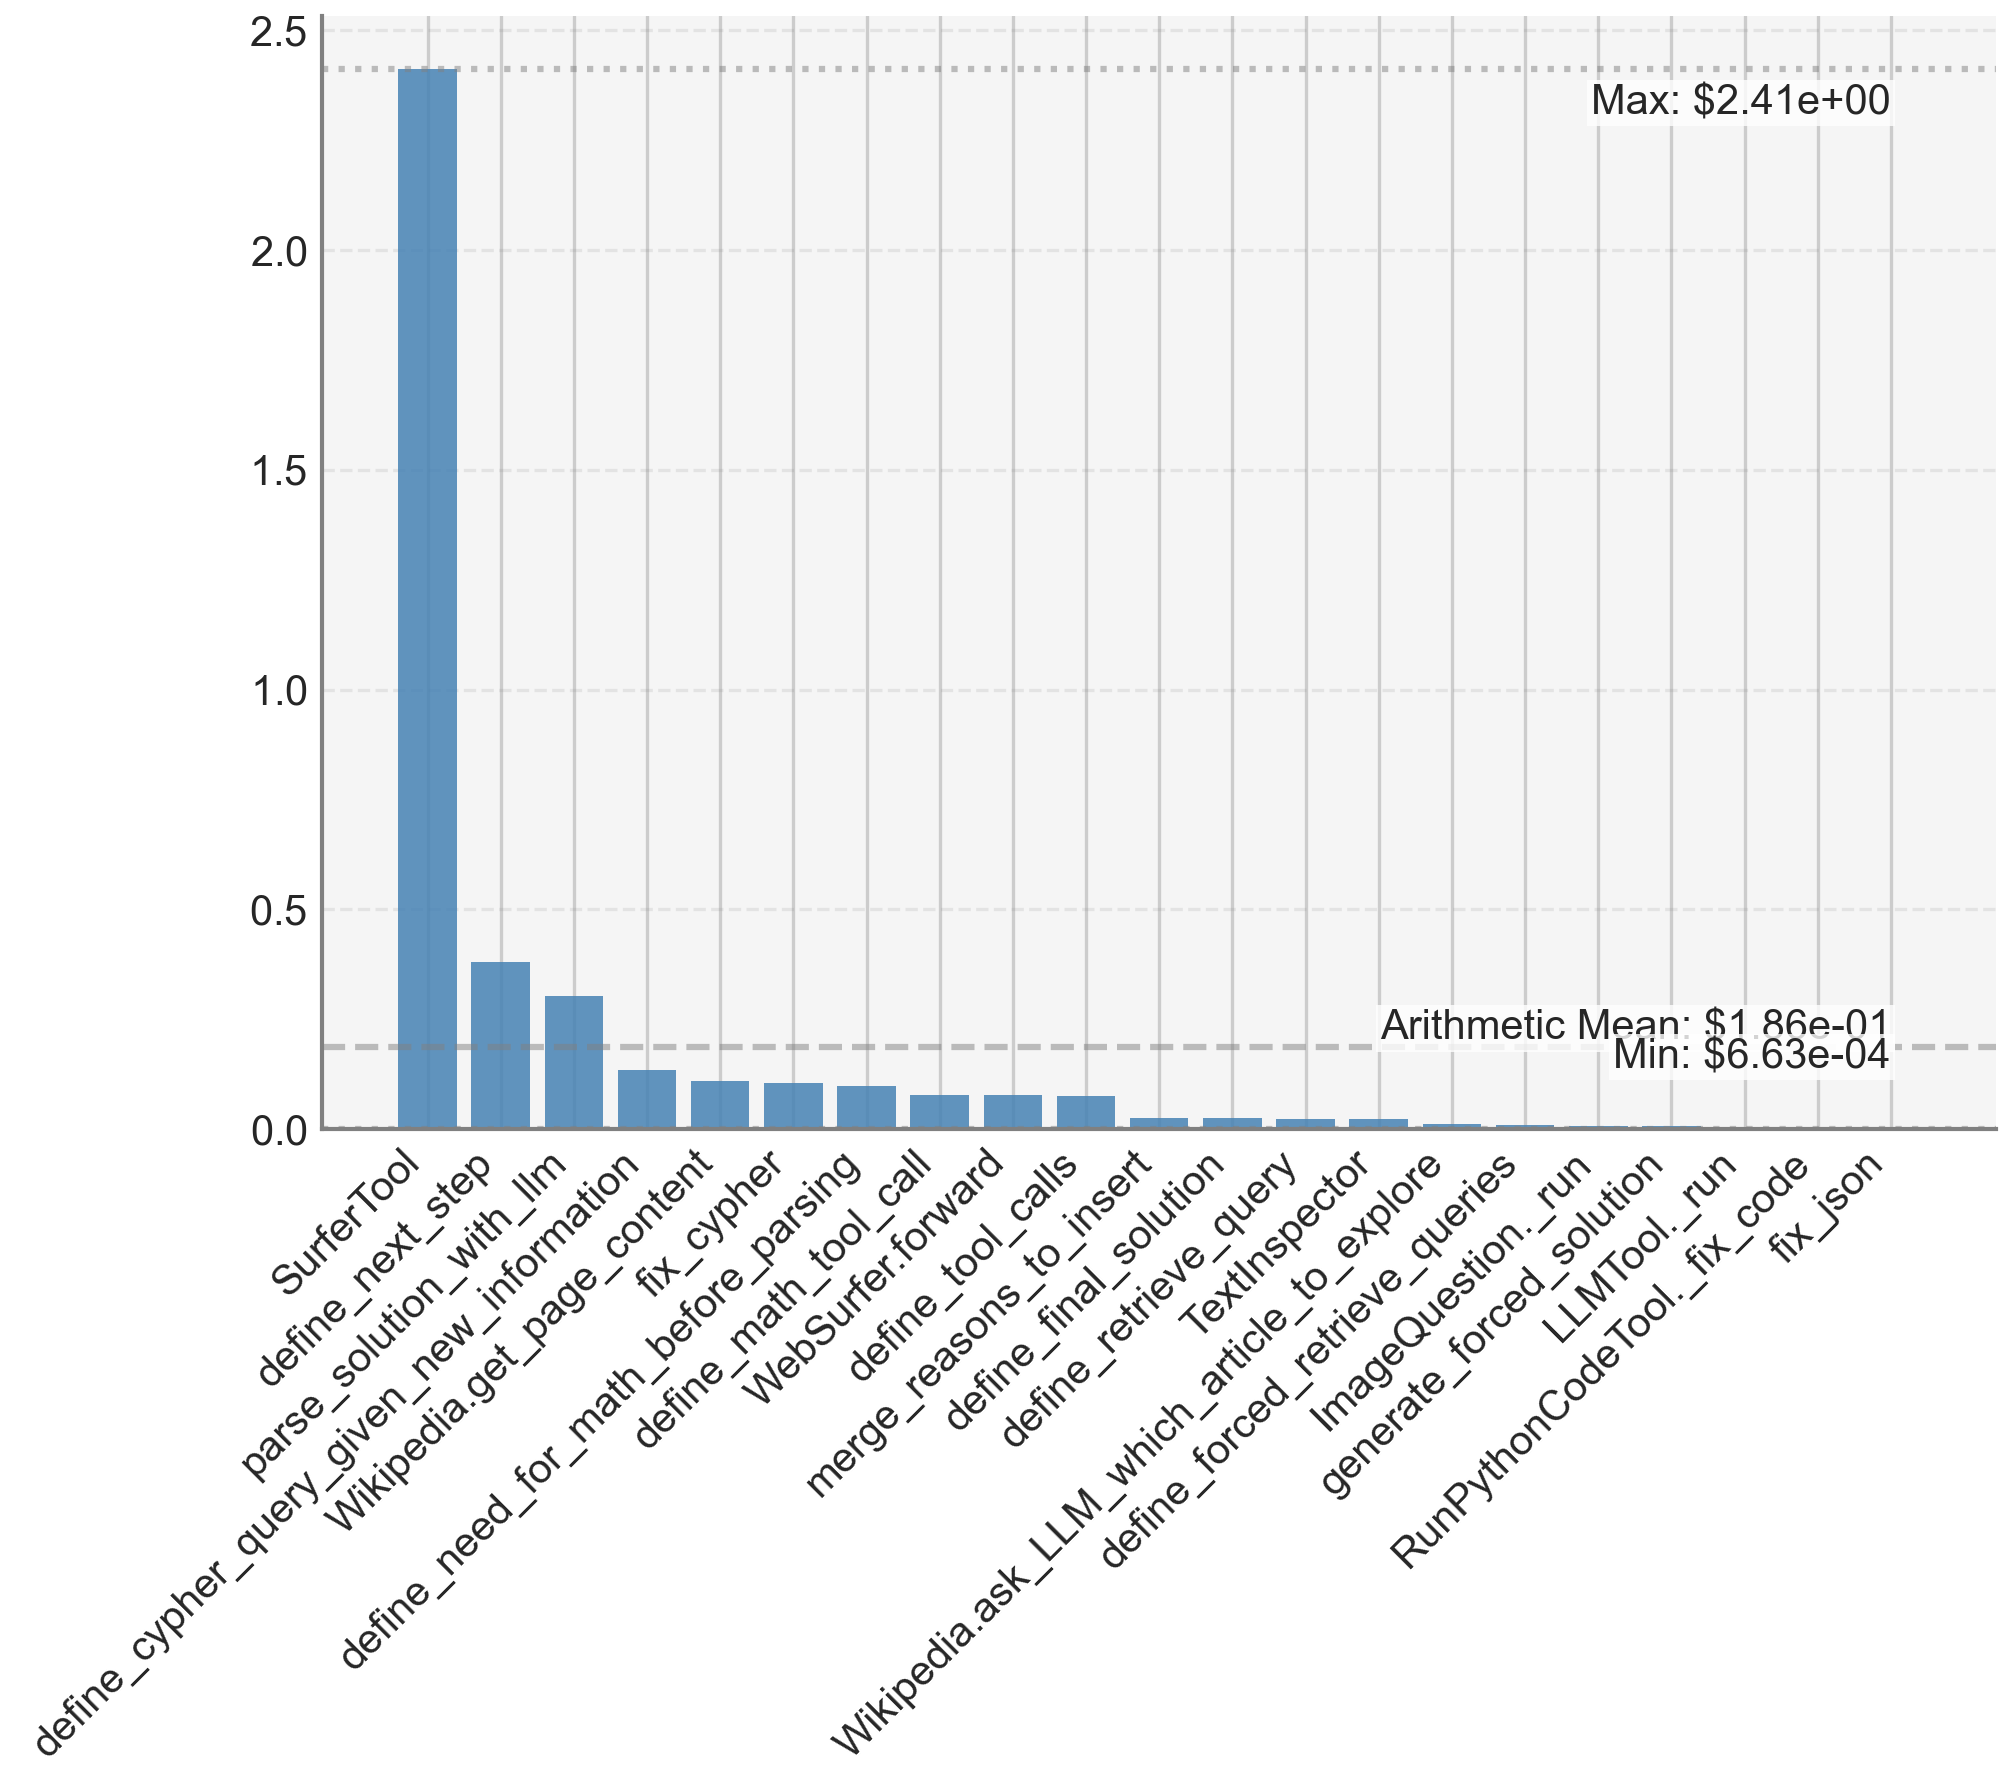
This is a vertical bar chart displaying the execution time of various tools. The x-axis represents the tool name, and the y-axis represents the execution time, measured in an unspecified unit (likely seconds). The chart shows a significant variation in execution times across different tools, with some tools taking considerably longer than others.
### Components/Axes
* **X-axis Label:** Tool Name
* **Y-axis Label:** Execution Time
* **Y-axis Scale:** Ranges from approximately 0.0 to 2.5.
* **Max Value:** $2.41e+00$ (approximately 2.41)
* **Min Value:** $6.63e-04$ (approximately 0.000663)
* **Arithmetic Mean:** $1.86e-01$ (approximately 0.186)
* **Tools (X-axis Categories):**
* `define_cypher_query`
* `SurferTool`
* `define_next_step`
* `parse_solution_with_llm`
* `Wikipedia.get_page_content`
* `define_need_for_math_before_parsing`
* `fix_cypher`
* `define_math_tool_call`
* `WebSurfer.forward`
* `define_tool_calls`
* `merge_reasons_to_insert`
* `define_final_solution`
* `define_retrieve_query`
* `TextInspector`
* `define_forced_to_explore`
* `retrieve_queries`
* `ImageQuestion.run`
* `define_forced_solution`
* `LLMTool.run`
* `generatePythonCodeTool.fix_code`
* `RunPythonCodeTool.fix_json`
* `Wikipedia.ask_LLM_which_article_to_explore`
### Detailed Analysis
The tallest bar corresponds to `define_cypher_query`, with an execution time of approximately 2.41. The shortest bar corresponds to `RunPythonCodeTool.fix_json`, with an execution time of approximately 0.000663.
Here's a breakdown of approximate execution times for each tool, reading from left to right:
* `define_cypher_query`: 2.41
* `SurferTool`: 2.15
* `define_next_step`: 1.85
* `parse_solution_with_llm`: 1.65
* `Wikipedia.get_page_content`: 1.45
* `define_need_for_math_before_parsing`: 1.25
* `fix_cypher`: 1.05
* `define_math_tool_call`: 0.85
* `WebSurfer.forward`: 0.75
* `define_tool_calls`: 0.65
* `merge_reasons_to_insert`: 0.55
* `define_final_solution`: 0.45
* `define_retrieve_query`: 0.35
* `TextInspector`: 0.25
* `define_forced_to_explore`: 0.15
* `retrieve_queries`: 0.12
* `ImageQuestion.run`: 0.09
* `define_forced_solution`: 0.07
* `LLMTool.run`: 0.05
* `generatePythonCodeTool.fix_code`: 0.03
* `RunPythonCodeTool.fix_json`: 0.000663
* `Wikipedia.ask_LLM_which_article_to_explore`: 0.02
The bars generally decrease in height as you move from left to right, although there are some fluctuations.
### Key Observations
* `define_cypher_query` and `SurferTool` are significantly slower than all other tools.
* `RunPythonCodeTool.fix_json` is exceptionally fast compared to the others.
* The execution times appear to be somewhat clustered, with a group of tools taking times between approximately 0.45 and 1.85.
* There is a large range in execution times, suggesting varying levels of complexity or resource requirements for each tool.
### Interpretation
The chart demonstrates the performance characteristics of a suite of tools, likely within a larger system. The significant differences in execution times suggest that some tools are computationally more intensive or rely on slower external resources (e.g., network access to Wikipedia). The tools `define_cypher_query` and `SurferTool` are potential bottlenecks in the system, as they take the longest to execute. The extremely fast execution of `RunPythonCodeTool.fix_json` suggests a highly optimized or trivial operation.
The data could be used to identify areas for performance optimization. For example, efforts could be focused on improving the efficiency of `define_cypher_query` and `SurferTool`. The chart also provides insight into the relative complexity of different tasks performed by the system. The mean execution time provides a baseline for evaluating the performance of individual tools. The large difference between the maximum and minimum values indicates a highly skewed distribution of execution times, meaning that a few tools dominate the overall execution time.