## Bar Chart: Distribution of Costs Across Components
### Overview
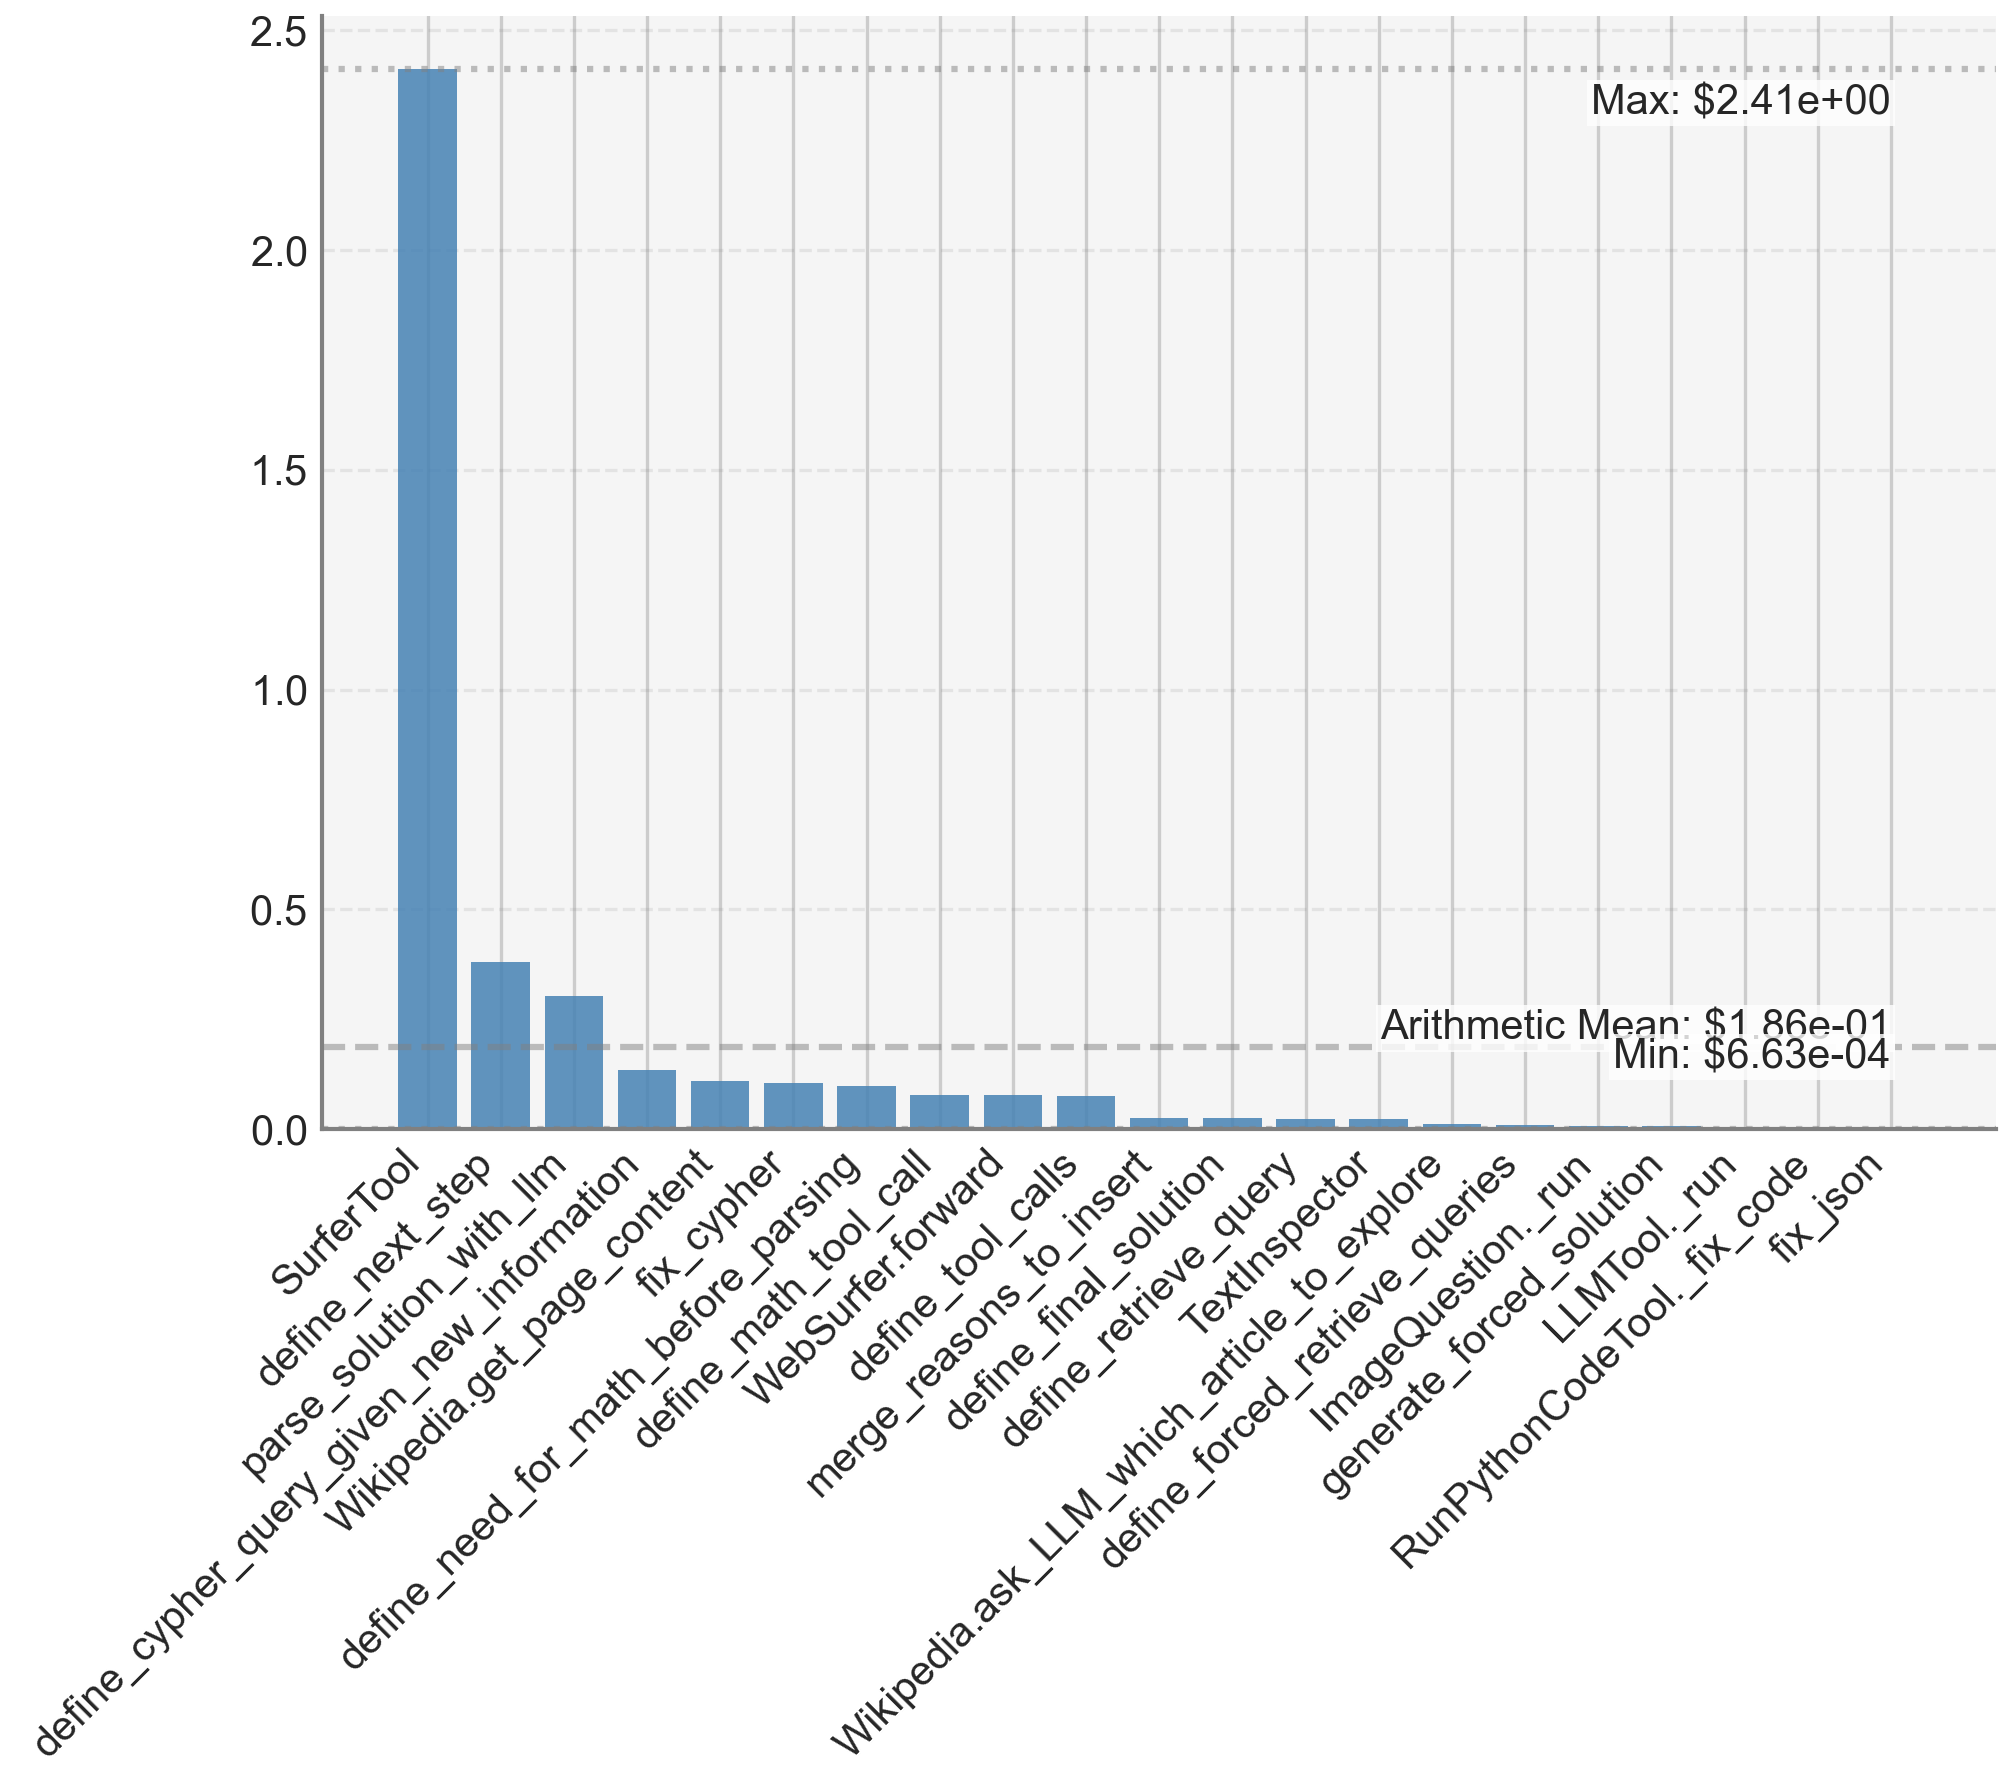
The chart displays a horizontal bar graph comparing the costs of 20 distinct components or processes. The y-axis represents monetary values in dollars, while the x-axis lists component names. The tallest bar corresponds to "SurferTool" at approximately $2.41, while the shortest bar ("fix_js") is near the minimum value of $0.0000663. An arithmetic mean line at $0.0186 is overlaid across the chart.
### Components/Axes
- **X-Axis (Categories)**:
`SurferTool`, `define_next_step`, `parse_solution_with_llm`, `define_cypher_query`, `define_new_information`, `Wikipedia.get_page_content`, `define_need_for_math`, `define_cypher_content`, `define_math_parsing`, `WebSurfer.forward_call`, `define_surfer_tool`, `merge_tool_calls`, `define_reasons_to_insert`, `define_final_solution`, `Wikipedia.ask_LLM`, `define_retrieve_query`, `TextInspect`, `define_article_to_explore`, `ImageQuestion`, `generate_forced_question`, `LLMTool`, `RunPythonCodeTool`, `fix_js`.
- **Y-Axis (Values)**:
Amount in dollars, ranging from ~$0.0000663 (minimum) to $2.41 (maximum).
- **Legend**:
Blue bars represent all components.
- **Annotations**:
- Max: $2.41 (SurferTool)
- Min: $0.0000663 (fix_js)
- Arithmetic Mean: $0.0186
### Detailed Analysis
- **SurferTool**: Dominates the chart with a bar height of ~$2.41, far exceeding all other components.
- **Top 5 Costs**:
1. `SurferTool` ($2.41)
2. `define_next_step` (~$0.35)
3. `parse_solution_with_llm` (~$0.30)
4. `define_cypher_query` (~$0.15)
5. `define_new_information` (~$0.12)
- **Mid-Range Costs**:
Components like `Wikipedia.get_page_content`, `define_need_for_math`, and `define_cypher_content` cluster between $0.05 and $0.10.
- **Low-Cost Components**:
Most remaining components (e.g., `merge_tool_calls`, `define_reasons_to_insert`, `fix_js`) fall below $0.01, with `fix_js` at the extreme minimum of $0.0000663.
- **Arithmetic Mean**:
The mean line at $0.0186 is positioned near the lower end of the chart, indicating that most components are inexpensive, but the outlier ("SurferTool") significantly skews the average upward.
### Key Observations
1. **Outlier Dominance**: "SurferTool" accounts for ~99.9% of the total cost, dwarfing all other components.
2. **Long-Tail Distribution**: 19 out of 20 components cost less than $0.10, with 15 costing less than $0.05.
3. **Mean vs. Median**: The arithmetic mean ($0.0186) is higher than the median (likely ~$0.01–$0.02), confirming the skewness caused by the outlier.
4. **Minimal Costs**: Components like `fix_js` and `LLMTool` operate at near-negligible costs (~$0.0000663–$0.0001).
### Interpretation
The chart reveals a stark imbalance in cost distribution, with "SurferTool" acting as a critical bottleneck. This suggests:
- **Resource Allocation**: Disproportionate investment in "SurferTool" compared to other components.
- **Efficiency Gaps**: Most processes are highly cost-effective, but "SurferTool" may require optimization or justification for its high expense.
- **Data Integrity**: The extreme outlier raises questions about whether "SurferTool" represents a one-time cost, recurring expense, or measurement error.
- **Strategic Focus**: Addressing the cost of "SurferTool" could yield significant savings, while other components are already optimized.
The chart underscores the importance of granular cost analysis in identifying inefficiencies and prioritizing optimization efforts.