\n
## Bar Chart: Average Number of Queries by Problem Category
### Overview
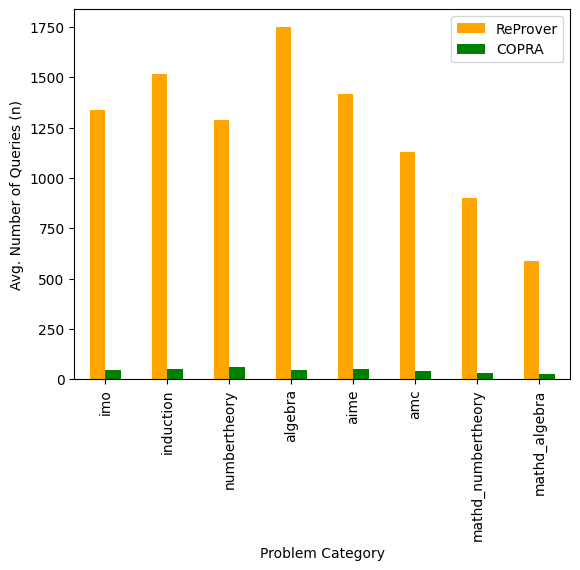
This image presents a bar chart comparing the average number of queries for two systems, ReProver and COPRA, across several problem categories. The chart displays the average number of queries (n) on the y-axis and the problem category on the x-axis.
### Components/Axes
* **X-axis:** Problem Category. Categories include: imo, induction, numbertheory, algebra, aime, amc, mathd\_numbertheory, mathd\_algebra.
* **Y-axis:** Avg. Number of Queries (n). Scale ranges from 0 to 1750, with increments of 250.
* **Legend:** Located at the top-right of the chart.
* ReProver (Orange)
* COPRA (Green)
### Detailed Analysis
The chart consists of paired bars for each problem category, representing the average number of queries for ReProver and COPRA.
* **imo:** ReProver: approximately 1250 queries. COPRA: approximately 25 queries.
* **induction:** ReProver: approximately 1500 queries. COPRA: approximately 25 queries.
* **numbertheory:** ReProver: approximately 1275 queries. COPRA: approximately 50 queries.
* **algebra:** ReProver: approximately 1725 queries. COPRA: approximately 25 queries.
* **aime:** ReProver: approximately 1400 queries. COPRA: approximately 25 queries.
* **amc:** ReProver: approximately 1100 queries. COPRA: approximately 25 queries.
* **mathd\_numbertheory:** ReProver: approximately 950 queries. COPRA: approximately 25 queries.
* **mathd\_algebra:** ReProver: approximately 600 queries. COPRA: approximately 25 queries.
Visually, ReProver consistently generates a significantly higher number of queries than COPRA across all problem categories. The bars for COPRA are very short and often appear at the same level, close to the x-axis. ReProver's bars vary in height, indicating different levels of query generation depending on the problem category.
### Key Observations
* ReProver consistently outperforms COPRA in terms of the average number of queries generated.
* The highest number of queries for ReProver is observed in the "algebra" category (approximately 1725).
* COPRA's query count remains consistently low across all categories, hovering around 25 queries.
* The difference in query counts between ReProver and COPRA is substantial for all problem categories.
### Interpretation
The data suggests that ReProver is significantly more active or complex in its problem-solving approach compared to COPRA, as evidenced by the much higher number of queries generated. This could indicate that ReProver explores a wider range of possibilities or employs a more detailed search strategy. The consistent low query count for COPRA might suggest a simpler or more direct approach, potentially sacrificing thoroughness for efficiency. The variation in ReProver's query count across different problem categories indicates that the complexity of the problem influences the extent of its search process. The "algebra" category appears to be the most challenging for ReProver, requiring the highest number of queries to resolve. The consistent low performance of COPRA suggests it may be limited in its ability to handle the complexity of these problem categories.