## Grouped Bar Chart: Average Number of Queries by Problem Category for ReProver and COPRA
### Overview
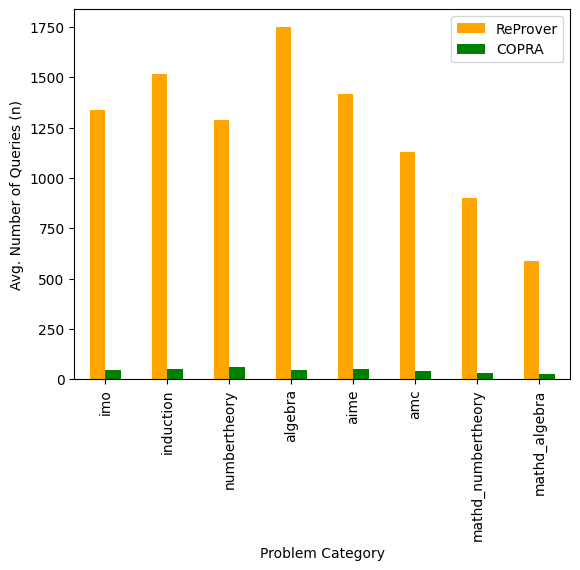
This is a grouped bar chart comparing the performance of two systems, **ReProver** (orange bars) and **COPRA** (green bars), across eight different mathematical problem categories. The metric being compared is the average number of queries required by each system.
### Components/Axes
* **Chart Type:** Grouped vertical bar chart.
* **X-Axis (Horizontal):** Labeled "Problem Category". It lists eight discrete categories:
1. `imo`
2. `induction`
3. `numbertheory`
4. `algebra`
5. `aime`
6. `amc`
7. `mathd_numbertheory`
8. `mathd_algebra`
* **Y-Axis (Vertical):** Labeled "Avg. Number of Queries (n)". The scale runs from 0 to 1750, with major tick marks at intervals of 250 (0, 250, 500, 750, 1000, 1250, 1500, 1750).
* **Legend:** Located in the top-right corner of the chart area.
* An orange square corresponds to the label **ReProver**.
* A green square corresponds to the label **COPRA**.
### Detailed Analysis
The chart presents a clear and consistent pattern: for every problem category, the orange bar (ReProver) is dramatically taller than the green bar (COPRA), indicating a much higher average query count.
**Trend Verification:** The data series for ReProver shows significant variation across categories, with values ranging from approximately 600 to 1750. The COPRA series is consistently very low, with all values appearing to be below 100.
**Category-by-Category Data Extraction (Approximate Values):**
1. **imo**
* ReProver (Orange): ~1350 queries
* COPRA (Green): ~50 queries
2. **induction**
* ReProver (Orange): ~1520 queries
* COPRA (Green): ~50 queries
3. **numbertheory**
* ReProver (Orange): ~1290 queries
* COPRA (Green): ~60 queries
4. **algebra**
* ReProver (Orange): ~1750 queries (appears to be the highest value on the chart)
* COPRA (Green): ~45 queries
5. **aime**
* ReProver (Orange): ~1420 queries
* COPRA (Green): ~50 queries
6. **amc**
* ReProver (Orange): ~1130 queries
* COPRA (Green): ~40 queries
7. **mathd_numbertheory**
* ReProver (Orange): ~900 queries
* COPRA (Green): ~25 queries
8. **mathd_algebra**
* ReProver (Orange): ~600 queries (appears to be the lowest value for ReProver)
* COPRA (Green): ~20 queries (appears to be the lowest value for COPRA)
### Key Observations
* **Dominant Pattern:** ReProver requires orders of magnitude more queries than COPRA across all tested problem domains. The difference is visually stark.
* **Peak and Trough for ReProver:** ReProver's highest average query count is in the `algebra` category (~1750), and its lowest is in the `mathd_algebra` category (~600).
* **Consistency of COPRA:** COPRA's performance is remarkably consistent and efficient, with average query counts remaining very low (estimated between 20-60) regardless of the problem category.
* **Smallest Gap:** The relative difference between the two systems is smallest in the `mathd_algebra` category, though ReProver still uses approximately 30 times more queries than COPRA in this case.
* **Category Grouping:** The two `mathd_` prefixed categories (`mathd_numbertheory`, `mathd_algebra`) show the lowest query counts for both systems compared to the other categories.
### Interpretation
The data strongly suggests a fundamental difference in the operational efficiency or strategy between the ReProver and COPRA systems for automated theorem proving or problem-solving in mathematics.
* **Efficiency vs. Effort:** COPRA demonstrates extreme query efficiency, solving problems with minimal interaction. This could indicate a more direct reasoning approach, better heuristics, or a more constrained search space. ReProver's high query count suggests a more exhaustive, iterative, or trial-and-error-based methodology.
* **Problem Difficulty Spectrum:** The variation in ReProver's performance across categories implies that some problem types (like `algebra`) are inherently more challenging for its approach, requiring more queries to resolve. In contrast, COPRA's flat performance suggests it is largely unaffected by the problem category within this test set.
* **Implications for Design:** The chart highlights a potential trade-off. While COPRA is clearly more efficient in terms of queries, the chart does not show success rates, proof quality, or computational time per query. ReProver's high query count might be a byproduct of a system designed for higher coverage or more complex proof discovery, albeit at a higher cost per problem.
* **The `mathd_` Anomaly:** The notably lower values for both systems in the `mathd_` categories could indicate these are a different, possibly simpler, subset of problems, or that both systems are particularly well-optimized for this format.