## 3D Scatter Plot: Latent Tokens vs. Vocab Tokens
### Overview
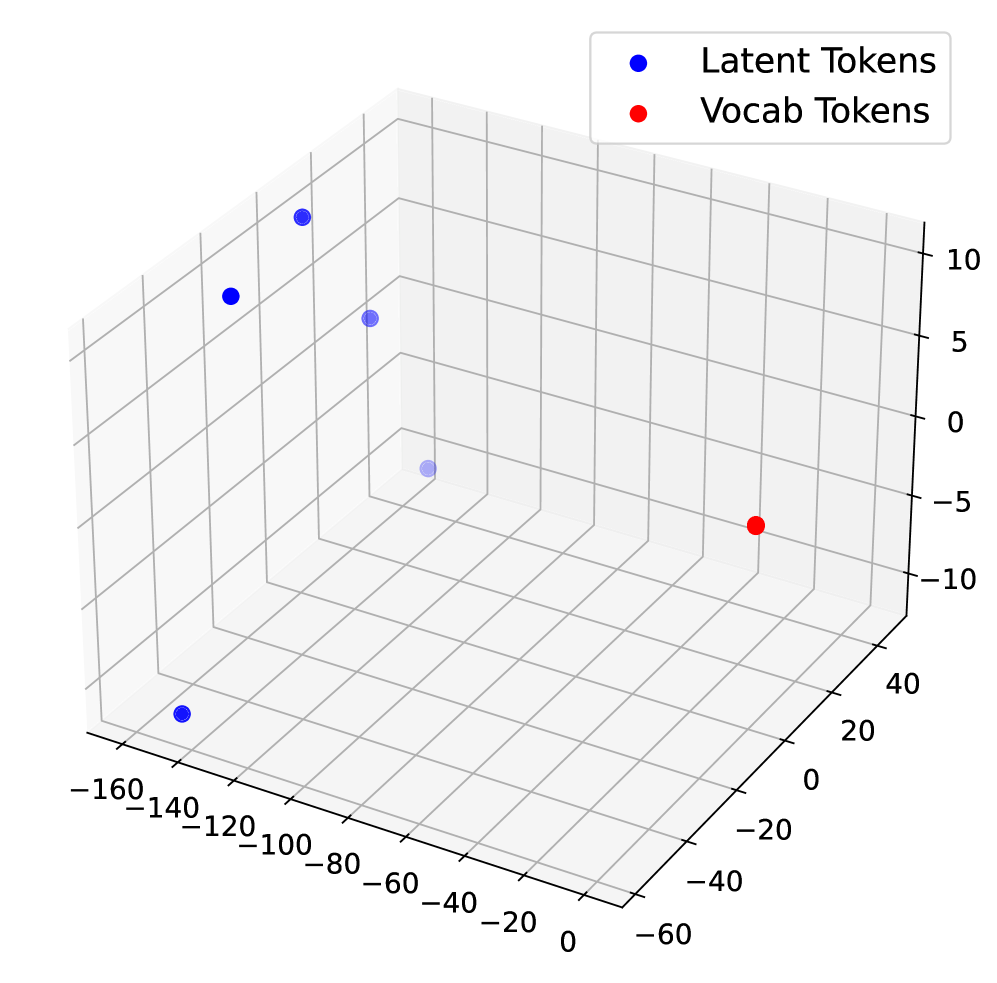
The image is a 3D scatter plot visualizing the distribution of "Latent Tokens" (blue) and "Vocab Tokens" (red) in a three-dimensional space. The plot shows the relative positions of these tokens, providing a visual representation of their relationships.
### Components/Axes
* **X-axis:** Ranges from approximately -160 to 0, with markers at -160, -140, -120, -100, -80, -60, -40, -20, and 0.
* **Y-axis:** Ranges from approximately -60 to 40, with markers at -60, -40, -20, 0, 20, and 40.
* **Z-axis:** Ranges from approximately -10 to 10, with markers at -10, -5, 0, 5, and 10.
* **Legend:** Located in the top-right corner, indicating "Latent Tokens" with blue dots and "Vocab Tokens" with red dots.
### Detailed Analysis
* **Latent Tokens (Blue):** There are four visible blue data points.
* Point 1: Located at approximately (-140, -60, -15).
* Point 2: Located at approximately (-120, 40, 8).
* Point 3: Located at approximately (-80, 40, 5).
* Point 4: Located at approximately (-40, -60, 0).
* **Vocab Tokens (Red):** There is one visible red data point.
* Point 1: Located at approximately (-20, 40, -5).
### Key Observations
* The "Latent Tokens" are spread across a wider range of the x-axis compared to the "Vocab Tokens."
* All "Latent Tokens" have negative x-axis values, while the "Vocab Token" has a negative x-axis value.
* The "Vocab Token" is positioned at a positive y-axis value.
* The "Latent Tokens" are positioned at both positive and negative y-axis values.
* The "Latent Tokens" are positioned at both positive and negative z-axis values.
* The "Vocab Token" is positioned at a negative z-axis value.
### Interpretation
The 3D scatter plot visualizes the spatial distribution of "Latent Tokens" and "Vocab Tokens." The plot suggests that "Latent Tokens" and "Vocab Tokens" occupy different regions in the three-dimensional space, indicating potential differences in their characteristics or relationships to the underlying data. The spread of "Latent Tokens" along the x-axis, compared to the single "Vocab Token," might indicate a greater diversity or variability within the "Latent Tokens" category. The specific coordinates of each token could represent feature embeddings or other numerical representations derived from the data.