\n
## 3D Scatter Plot: Latent vs. Vocabulary Tokens
### Overview
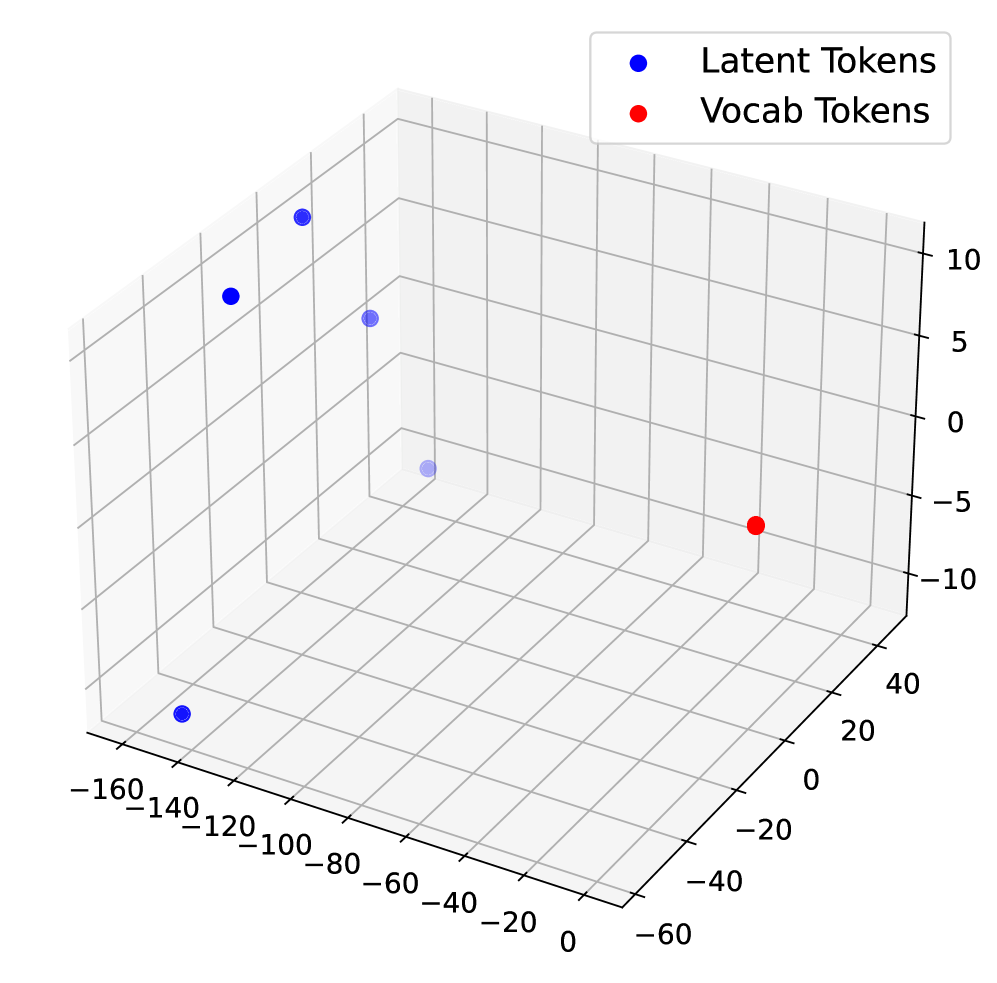
The image presents a 3D scatter plot visualizing the distribution of "Latent Tokens" and "Vocab Tokens" in a three-dimensional space. The plot uses blue spheres to represent Latent Tokens and red spheres to represent Vocab Tokens. The axes are not explicitly labeled with units, but are numerical scales.
### Components/Axes
* **X-axis:** Ranges approximately from -160 to 140.
* **Y-axis:** Ranges approximately from -60 to 40.
* **Z-axis:** Ranges approximately from -10 to 10.
* **Legend:** Located in the top-right corner.
* Blue circle: "Latent Tokens"
* Red circle: "Vocab Tokens"
### Detailed Analysis
The plot contains a small number of data points. Let's analyze each series:
**Latent Tokens (Blue Spheres):**
There are five blue spheres representing Latent Tokens.
* Point 1: Approximately (-140, -60, 2).
* Point 2: Approximately (-120, -60, 7).
* Point 3: Approximately (-80, -40, 8).
* Point 4: Approximately (-40, 0, 1).
* Point 5: Approximately (0, 20, 6).
The Latent Tokens generally trend upwards and to the right as the X and Y values increase, with a slight increase in the Z value.
**Vocab Tokens (Red Spheres):**
There is one red sphere representing a Vocab Token.
* Point 1: Approximately (20, -60, -6).
The Vocab Token is located in the bottom-right quadrant of the plot, with a negative Z value.
### Key Observations
* There is a significant disparity in the number of Latent Tokens and Vocab Tokens represented in the plot.
* The Latent Tokens appear to cluster in the upper-left quadrant of the plot, while the single Vocab Token is isolated in the lower-right.
* The Z-axis values for the Latent Tokens are generally positive, while the Vocab Token has a negative Z-axis value.
### Interpretation
The plot suggests a potential separation between Latent Tokens and Vocab Tokens in this three-dimensional space. The clustering of Latent Tokens and the isolation of the Vocab Token could indicate distinct characteristics or roles within the system being modeled. The difference in Z-axis values might represent a different "dimension" of meaning or importance.
The limited number of data points makes it difficult to draw definitive conclusions. A larger dataset would be needed to confirm these initial observations and explore the relationships between these token types in more detail. The plot could be visualizing embeddings of tokens, where proximity in the 3D space represents semantic similarity. The separation suggests that Latent and Vocab Tokens have different semantic properties. The negative Z-value for the Vocab Token could indicate a different type of semantic relationship or a different level of abstraction.