# Technical Document Extraction: Flowchart Analysis
## Overview
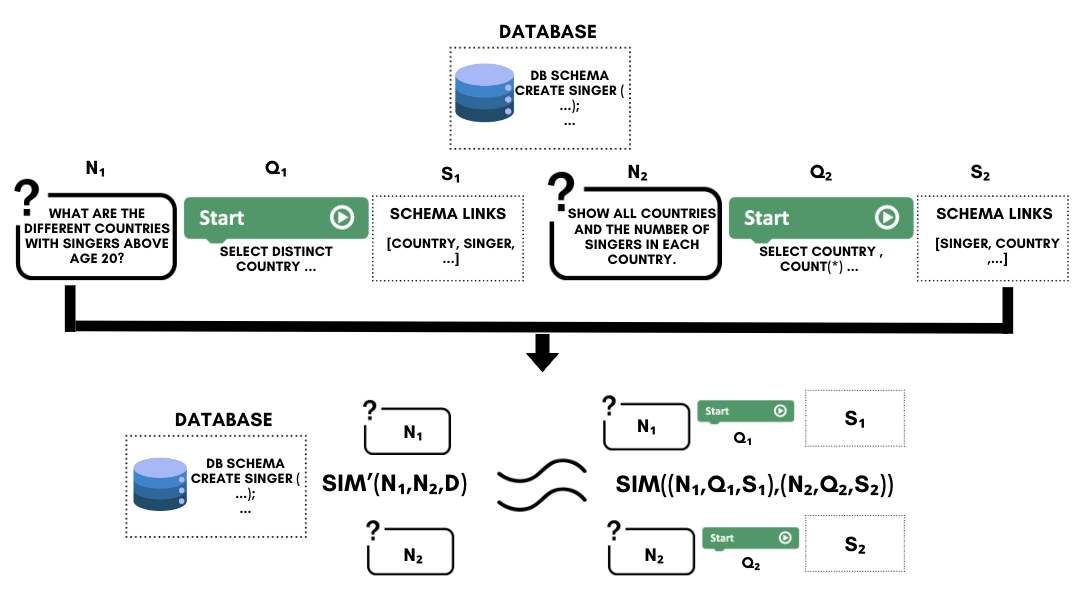
The image depicts a **two-section flowchart** illustrating a database schema and query processing logic for singer data. The diagram uses **textual components** (questions, buttons, schema links) and **mathematical notation** to represent data relationships.
---
## Top Section: Query Processing Flowchart
### 1. Database Schema
- **Label**: `DATABASE`
- **Schema**: `DB SCHEMA CREATE SINGER(...)`
- Represents a database table/structure for singer data.
### 2. Query Components
#### Question 1 (`N1`)
- **Text**: `WHAT ARE THE DIFFERENT COUNTRIES WITH SINGERS ABOVE AGE 20?`
- **Flow**:
- Connects to `Q1` (Start button) via a black arrow.
- Leads to `S1` (Schema Link).
#### Start Button 1 (`Q1`)
- **Label**: `Start` (green button with play icon)
- **Action**: `SELECT DISTINCT COUNTRY ...`
#### Schema Link 1 (`S1`)
- **Parameters**: `[COUNTRY, SINGER, ...]`
- Represents a database query or schema path.
#### Question 2 (`N2`)
- **Text**: `SHOW ALL COUNTRIES AND THE NUMBER OF SINGERS IN EACH COUNTRY.`
- **Flow**:
- Connects to `Q2` (Start button) via a black arrow.
- Leads to `S2` (Schema Link).
#### Start Button 2 (`Q2`)
- **Label**: `Start` (green button with play icon)
- **Action**: `SELECT COUNTRY, COUNT(*) ...`
#### Schema Link 2 (`S2`)
- **Parameters**: `[SINGER, COUNTRY, ...]`
- Represents a database query or schema path.
---
## Bottom Section: Database Schema & Similarity Functions
### 1. Database Schema
- **Label**: `DATABASE`
- **Schema**: `DB SCHEMA CREATE SINGER(...)`
- Repeats the top-section schema definition.
### 2. Similarity Functions
#### Function 1 (`SIM'(N1, N2, D)`)
- **Parameters**:
- `N1`, `N2`: Query identifiers (from `N1` and `N2`).
- `D`: Database schema reference.
#### Function 2 (`SIM((N1, Q1, S1), (N2, Q2, S2))`)
- **Parameters**:
- `(N1, Q1, S1)`: Tuple of Question 1 components.
- `(N2, Q2, S2)`: Tuple of Question 2 components.
- Represents a similarity calculation between query results.
---
## Key Observations
1. **Flow Direction**:
- Top flowchart progresses from `N1` → `Q1` → `S1` and `N2` → `Q2` → `S2`.
- Bottom section links queries to similarity functions via `SIM'`.
2. **Schema Consistency**:
- Both sections reference the same `DB SCHEMA CREATE SINGER(...)`.
3. **Mathematical Notation**:
- Uses `SIM'` and `SIM(...)` to denote similarity operations between query results.
---
## Missing Elements
- No numerical data, charts, or axis labels present.
- No legends or color-coded data series.
- No explicit spatial coordinates (e.g., [x, y] placements).
---
## Conclusion
The diagram outlines a **query-driven database workflow** for singer data, emphasizing schema design and similarity analysis between query results. All textual components are explicitly labeled, with no omitted information.