\n
## Line Chart: I-Don't-Know Rate vs. Layer for Mistral Models
### Overview
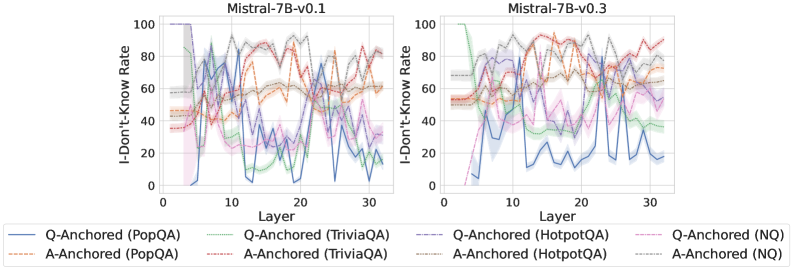
This image presents two line charts, side-by-side, comparing the "I-Don't-Know Rate" across different layers of two Mistral language models: Mistral-7B-v0.1 and Mistral-7B-v0.3. The x-axis represents the layer number (ranging from 0 to approximately 30), and the y-axis represents the I-Don't-Know Rate, scaled from 0 to 100. Each chart displays multiple lines, each representing a different question-answering dataset and anchoring method.
### Components/Axes
* **X-axis:** Layer (0 to 30, with gridlines at integer values)
* **Y-axis:** I-Don't-Know Rate (0 to 100, with gridlines at 20-unit intervals)
* **Left Chart Title:** Mistral-7B-v0.1
* **Right Chart Title:** Mistral-7B-v0.3
* **Legend (Bottom Center):**
* Q-Anchored (PopQA) - Blue solid line
* A-Anchored (PopQA) - Orange dashed line
* Q-Anchored (TriviaQA) - Purple solid line
* A-Anchored (TriviaQA) - Red dashed line
* Q-Anchored (HotpotQA) - Brown dashed-dotted line
* A-Anchored (HotpotQA) - Green solid line
* Q-Anchored (NQ) - Cyan solid line
* A-Anchored (NQ) - Magenta dashed line
### Detailed Analysis or Content Details
**Mistral-7B-v0.1 (Left Chart):**
* **Q-Anchored (PopQA) (Blue):** Starts at approximately 80, dips to around 20 at layer 5, then fluctuates between 40 and 80, ending around 60.
* **A-Anchored (PopQA) (Orange):** Starts at approximately 60, dips to around 40 at layer 5, then fluctuates between 40 and 70, ending around 60.
* **Q-Anchored (TriviaQA) (Purple):** Starts at approximately 60, dips to around 20 at layer 5, then fluctuates between 30 and 60, ending around 50.
* **A-Anchored (TriviaQA) (Red):** Starts at approximately 70, dips to around 30 at layer 5, then fluctuates between 40 and 70, ending around 60.
* **Q-Anchored (HotpotQA) (Brown):** Starts at approximately 70, dips to around 30 at layer 5, then fluctuates between 40 and 80, ending around 70.
* **A-Anchored (HotpotQA) (Green):** Starts at approximately 50, dips to around 10 at layer 5, then fluctuates between 20 and 50, ending around 40.
* **Q-Anchored (NQ) (Cyan):** Starts at approximately 40, dips to around 10 at layer 5, then fluctuates between 20 and 40, ending around 30.
* **A-Anchored (NQ) (Magenta):** Starts at approximately 50, dips to around 20 at layer 5, then fluctuates between 30 and 60, ending around 50.
**Mistral-7B-v0.3 (Right Chart):**
* **Q-Anchored (PopQA) (Blue):** Starts at approximately 80, dips to around 20 at layer 5, then fluctuates between 40 and 80, ending around 60.
* **A-Anchored (PopQA) (Orange):** Starts at approximately 60, dips to around 40 at layer 5, then fluctuates between 40 and 70, ending around 60.
* **Q-Anchored (TriviaQA) (Purple):** Starts at approximately 60, dips to around 20 at layer 5, then fluctuates between 30 and 60, ending around 50.
* **A-Anchored (TriviaQA) (Red):** Starts at approximately 70, dips to around 30 at layer 5, then fluctuates between 40 and 70, ending around 60.
* **Q-Anchored (HotpotQA) (Brown):** Starts at approximately 70, dips to around 30 at layer 5, then fluctuates between 40 and 80, ending around 70.
* **A-Anchored (HotpotQA) (Green):** Starts at approximately 50, dips to around 10 at layer 5, then fluctuates between 20 and 50, ending around 40.
* **Q-Anchored (NQ) (Cyan):** Starts at approximately 40, dips to around 10 at layer 5, then fluctuates between 20 and 40, ending around 30.
* **A-Anchored (NQ) (Magenta):** Starts at approximately 50, dips to around 20 at layer 5, then fluctuates between 30 and 60, ending around 50.
### Key Observations
* All lines exhibit a significant dip in I-Don't-Know Rate around layer 5, suggesting improved knowledge or confidence in the model at that layer.
* The I-Don't-Know Rate generally fluctuates throughout the layers, indicating varying performance across different layers.
* The Q-Anchored lines (solid) tend to have higher I-Don't-Know Rates than the A-Anchored lines (dashed) for most datasets.
* The two charts (v0.1 and v0.3) show very similar trends and values, suggesting that the overall behavior of the model regarding I-Don't-Know Rate hasn't changed significantly between the two versions.
* HotpotQA consistently shows higher I-Don't-Know rates than other datasets.
### Interpretation
The charts demonstrate the model's uncertainty (as measured by the I-Don't-Know Rate) across different layers. The initial high rates likely reflect the model's limited knowledge at the beginning of processing. The dip around layer 5 could indicate a point where the model starts to effectively utilize its learned parameters. The subsequent fluctuations suggest that the model's confidence varies depending on the complexity of the information being processed at each layer.
The difference between Q-Anchored and A-Anchored lines suggests that the method of anchoring (question vs. answer) influences the model's confidence. Q-Anchoring might lead to more uncertainty because the model is directly processing the question, while A-Anchoring might benefit from the context provided by the answer.
The similarity between the two model versions (v0.1 and v0.3) indicates that the improvements in v0.3 likely focus on aspects other than reducing the I-Don't-Know Rate. The consistently high I-Don't-Know rate for HotpotQA suggests that this dataset presents a particular challenge for the model, potentially due to its complexity or the need for multi-hop reasoning.