TECHNICAL ASSET FINGERPRINT
92be705fefb3ad42553a2430
Click to view fullscreen
Press ESC or click to close
FOUND IN PAPERS
EXPERT: healer-alpha-free VERSION 1
RUNTIME: free/openrouter/healer-alpha
INTEL_VERIFIED
\n
## Line Charts: Comparison of "I-Don't-Know Rate" Across Model Layers for Two Mistral-7B Versions
### Overview
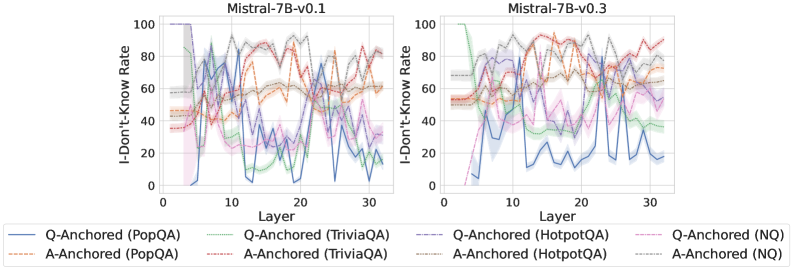
The image displays two side-by-side line charts comparing the "I-Don't-Know Rate" (a measure of model uncertainty or refusal to answer) across the 32 layers of two different versions of the Mistral-7B language model: version 0.1 (left chart) and version 0.3 (right chart). Each chart plots multiple data series representing different question-answering datasets, further broken down by two "anchoring" methods (Q-Anchored and A-Anchored).
### Components/Axes
* **Chart Titles:**
* Left Chart: `Mistral-7B-v0.1`
* Right Chart: `Mistral-7B-v0.3`
* **Y-Axis (Both Charts):** Label: `I-Don't-Know Rate`. Scale: 0 to 100, with major gridlines at intervals of 20 (0, 20, 40, 60, 80, 100).
* **X-Axis (Both Charts):** Label: `Layer`. Scale: 0 to 30, with major tick marks labeled at 0, 10, 20, and 30. The data appears to cover all 32 layers (0-31).
* **Legend (Bottom Center, spanning both charts):** Contains 8 entries, differentiating lines by color and style (solid vs. dashed).
* **Solid Lines (Q-Anchored):**
* Blue: `Q-Anchored (PopQA)`
* Green: `Q-Anchored (TriviaQA)`
* Purple: `Q-Anchored (HotpotQA)`
* Pink: `Q-Anchored (NQ)`
* **Dashed Lines (A-Anchored):**
* Orange: `A-Anchored (PopQA)`
* Red: `A-Anchored (TriviaQA)`
* Brown: `A-Anchored (HotpotQA)`
* Gray: `A-Anchored (NQ)`
### Detailed Analysis
**Chart 1: Mistral-7B-v0.1 (Left)**
* **General Trend:** High variability and volatility across all layers for all data series. Lines frequently cross and show sharp peaks and troughs.
* **Q-Anchored Series (Solid Lines):**
* `PopQA (Blue)`: Starts near 0 at layer 0, spikes to ~80 by layer 5, then fluctuates wildly between ~10 and ~80 for the remaining layers.
* `TriviaQA (Green)`: Starts around 40, shows a general downward trend with significant noise, ending near 20 at layer 30.
* `HotpotQA (Purple)`: Starts around 50, exhibits large oscillations, with peaks near 90 and troughs near 20.
* `NQ (Pink)`: Starts around 40, shows a slight overall downward trend but with high variance, ending near 30.
* **A-Anchored Series (Dashed Lines):**
* `PopQA (Orange)`: Starts around 45, shows a gradual upward trend with fluctuations, ending near 60.
* `TriviaQA (Red)`: Starts around 45, trends upward with high volatility, reaching peaks near 90.
* `HotpotQA (Brown)`: Starts around 50, shows a general upward trend, ending near 80.
* `NQ (Gray)`: Starts around 55, remains relatively high and stable compared to others, fluctuating between 60 and 90.
**Chart 2: Mistral-7B-v0.3 (Right)**
* **General Trend:** Shows more structured and less chaotic patterns compared to v0.1. Several series exhibit clearer directional trends (upward or downward) across layers.
* **Q-Anchored Series (Solid Lines):**
* `PopQA (Blue)`: Starts near 0, rises to ~40 by layer 5, then follows a distinct downward trend, reaching near 0 again by layer 30.
* `TriviaQA (Green)`: Starts very high (~100), drops sharply to ~40 by layer 5, then continues a steady decline to near 0.
* `HotpotQA (Purple)`: Starts around 50, shows a general downward trend with moderate fluctuations, ending near 30.
* `NQ (Pink)`: Starts around 40, shows a gradual downward trend, ending near 20.
* **A-Anchored Series (Dashed Lines):**
* `PopQA (Orange)`: Starts around 50, shows a clear upward trend, ending near 80.
* `TriviaQA (Red)`: Starts around 50, shows a strong upward trend, becoming one of the highest lines, ending near 90.
* `HotpotQA (Brown)`: Starts around 55, shows a steady upward trend, ending near 85.
* `NQ (Gray)`: Starts around 60, remains high and relatively stable, fluctuating between 70 and 90.
### Key Observations
1. **Version Comparison:** The transition from v0.1 to v0.3 results in a dramatic reduction of noise and volatility in the "I-Don't-Know Rate" across layers. Trends become more monotonic and interpretable.
2. **Anchoring Effect:** A consistent and striking pattern emerges in v0.3: **Q-Anchored methods (solid lines) generally show a *decreasing* "I-Don't-Know Rate" as layer depth increases**, while **A-Anchored methods (dashed lines) show an *increasing* rate**. This divergence is much less clear in the noisy v0.1 chart.
3. **Dataset Sensitivity:** The magnitude and trend of the rate vary by dataset. For example, in v0.3, `TriviaQA` shows the most extreme changes (very high start for Q-Anchored, strong rise for A-Anchored), while `NQ` shows more moderate, stable values.
4. **Early Layer Behavior:** In both models, the first few layers (0-5) often show rapid changes, suggesting this is a critical region for the model's internal "decision" about whether it can answer a question.
### Interpretation
This data visualizes how two iterations of the same language model differ in their internal processing of uncertainty. The "I-Don't-Know Rate" likely reflects the model's confidence or its tendency to activate a refusal mechanism at different stages (layers) of its computation.
* **Model Evolution (v0.1 -> v0.3):** The shift from chaotic to structured patterns suggests v0.3 has a more calibrated and consistent internal representation of uncertainty across its layers. The noise in v0.1 might indicate instability in how uncertainty signals propagate.
* **The Anchoring Dichotomy:** The clear inverse relationship between Q-Anchored and A-Anchored methods in v0.3 is the most significant finding. It implies:
* **Q-Anchored (Question-Anchored):** As information flows deeper into the network (higher layers), the model becomes *more confident* (lower "I-Don't-Know" rate) when processing questions anchored to the query itself.
* **A-Anchored (Answer-Anchored):** Conversely, when processing information anchored to potential answers, the model becomes *less confident* (higher "I-Don't-Know" rate) in deeper layers. This could suggest deeper layers are better at detecting inconsistencies or lack of support for answer candidates.
* **Practical Implication:** This analysis provides a "map" of where uncertainty resides within the model. For v0.3, interventions to improve calibration could target early layers for Q-Anchored processing and later layers for A-Anchored processing. The stark difference between datasets also highlights that model confidence is not a monolithic property but is highly dependent on the type of knowledge being queried.
DECODING INTELLIGENCE...