## Line Graph: I-Don't-Know Rate Across Layers in Mistral-7B Models (v0.1 and v0.3)
### Overview
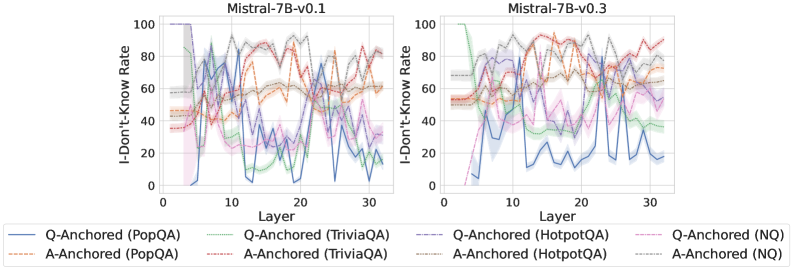
The image contains two line graphs comparing the "I-Don't-Know Rate" across 30 layers of the Mistral-7B model (versions v0.1 and v0.3). Each graph tracks performance across four datasets (PopQA, TriviaQA, HotpotQA, NQ) using Q-Anchored and A-Anchored methods. The graphs show significant variability in performance, with overlapping trends and sharp fluctuations in certain layers.
---
### Components/Axes
- **X-Axis (Layer)**: Ranges from 0 to 30, labeled "Layer."
- **Y-Axis (I-Don't-Know Rate)**: Ranges from 0 to 100, labeled "I-Don't-Know Rate."
- **Legends**:
- **Left Graph (v0.1)**:
- Solid blue: Q-Anchored (PopQA)
- Dashed orange: A-Anchored (PopQA)
- Solid green: Q-Anchored (TriviaQA)
- Dashed red: A-Anchored (TriviaQA)
- Solid purple: Q-Anchored (HotpotQA)
- Dashed gray: A-Anchored (HotpotQA)
- Solid pink: Q-Anchored (NQ)
- Dashed black: A-Anchored (NQ)
- **Right Graph (v0.3)**:
- Same legend structure as v0.1, but with updated line colors/styles for v0.3.
---
### Detailed Analysis
#### Left Graph (Mistral-7B-v0.1)
- **Q-Anchored (PopQA)**: Solid blue line. Peaks at ~80% in layer 10, drops to ~20% by layer 30.
- **A-Anchored (PopQA)**: Dashed orange line. Stable around 40–60%, with minor fluctuations.
- **Q-Anchored (TriviaQA)**: Solid green line. Sharp spike to ~90% at layer 5, then declines.
- **A-Anchored (TriviaQA)**: Dashed red line. Gradual decline from ~70% to ~30%.
- **Q-Anchored (HotpotQA)**: Solid purple line. Peaks at ~70% in layer 15, then stabilizes.
- **A-Anchored (HotpotQA)**: Dashed gray line. Fluctuates between 50–70%.
- **Q-Anchored (NQ)**: Solid pink line. Sharp drop from ~90% at layer 5 to ~10% by layer 30.
- **A-Anchored (NQ)**: Dashed black line. Stable at ~40–50%.
#### Right Graph (Mistral-7B-v0.3)
- **Q-Anchored (PopQA)**: Solid blue line. Peaks at ~70% in layer 20, then declines.
- **A-Anchored (PopQA)**: Dashed orange line. Stable at ~50–60%.
- **Q-Anchored (TriviaQA)**: Solid green line. Peaks at ~80% in layer 10, then drops.
- **A-Anchored (TriviaQA)**: Dashed red line. Gradual decline from ~60% to ~20%.
- **Q-Anchored (HotpotQA)**: Solid purple line. Peaks at ~60% in layer 25, then stabilizes.
- **A-Anchored (HotpotQA)**: Dashed gray line. Fluctuates between 40–60%.
- **Q-Anchored (NQ)**: Solid pink line. Sharp drop from ~80% at layer 5 to ~15% by layer 30.
- **A-Anchored (NQ)**: Dashed black line. Stable at ~30–40%.
---
### Key Observations
1. **Layer-Specific Variability**: Both models show erratic I-Don't-Know rates in early layers (e.g., layer 5–10), suggesting instability in initial processing.
2. **Dataset Differences**:
- TriviaQA consistently exhibits higher I-Don't-Know rates than other datasets.
- NQ shows the most dramatic drops in Q-Anchored methods, indicating improved performance in later layers.
3. **Model Version Comparison**:
- v0.3 generally has lower I-Don't-Know rates than v0.1, especially in later layers (e.g., layer 20–30).
- A-Anchored methods (dashed lines) are more stable across layers compared to Q-Anchored (solid lines).
---
### Interpretation
The data suggests that anchoring methods (Q vs. A) and dataset type significantly impact the I-Don't-Know rate. Q-Anchored methods show higher variability and sharper declines in later layers, while A-Anchored methods maintain steadier performance. The reduction in I-Don't-Know rates in v0.3 compared to v0.1 implies architectural improvements in Mistral-7B. Notably, TriviaQA’s high rates across layers may indicate domain-specific challenges, while NQ’s steep declines suggest better generalization in later layers. These trends highlight the importance of anchoring strategies and model versioning in handling uncertainty.