\n
## Line Chart: Accuracy vs. Number of Solutions
### Overview
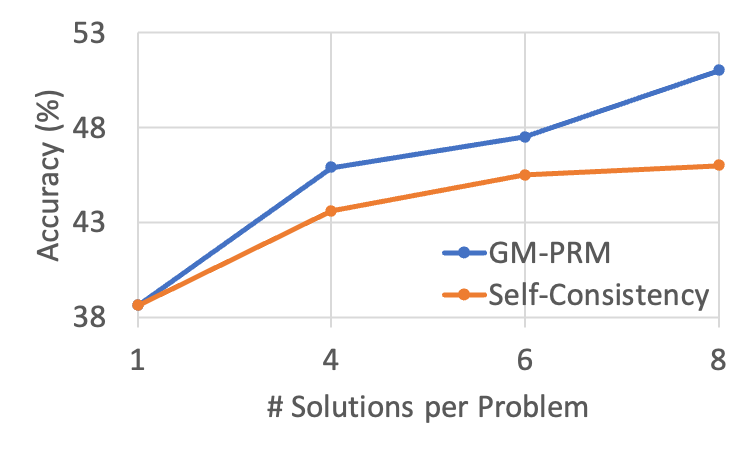
This line chart compares the accuracy of two methods, GM-PRM and Self-Consistency, as the number of solutions per problem increases. The x-axis represents the number of solutions, ranging from 1 to 8, while the y-axis represents accuracy, measured in percentage (%).
### Components/Axes
* **X-axis Title:** "# Solutions per Problem"
* **Y-axis Title:** "Accuracy (%)"
* **X-axis Markers:** 1, 4, 6, 8
* **Y-axis Markers:** 38, 40, 42, 44, 46, 48, 50, 52
* **Legend:**
* GM-PRM (Blue Line)
* Self-Consistency (Orange Line)
* **Legend Position:** Bottom-right corner of the chart.
### Detailed Analysis
**GM-PRM (Blue Line):** The blue line representing GM-PRM shows an upward trend, indicating increasing accuracy as the number of solutions increases.
* At 1 solution: Approximately 40% accuracy.
* At 4 solutions: Approximately 46% accuracy.
* At 6 solutions: Approximately 47.5% accuracy.
* At 8 solutions: Approximately 51.5% accuracy.
**Self-Consistency (Orange Line):** The orange line representing Self-Consistency shows an initial increase in accuracy, followed by a plateau.
* At 1 solution: Approximately 38.5% accuracy.
* At 4 solutions: Approximately 43.5% accuracy.
* At 6 solutions: Approximately 44% accuracy.
* At 8 solutions: Approximately 44.5% accuracy.
### Key Observations
* GM-PRM consistently outperforms Self-Consistency across all tested numbers of solutions.
* The accuracy of GM-PRM continues to increase with more solutions, while Self-Consistency's accuracy plateaus after 4 solutions.
* The difference in accuracy between the two methods widens as the number of solutions increases.
### Interpretation
The data suggests that GM-PRM benefits more from increasing the number of solutions per problem than Self-Consistency does. This could indicate that GM-PRM is better at leveraging multiple perspectives or approaches to arrive at a more accurate solution. The plateau in Self-Consistency's accuracy suggests that it reaches a limit in its ability to improve with more solutions, potentially due to inherent constraints in its methodology. The widening gap in accuracy between the two methods highlights the potential advantages of GM-PRM for tasks where generating multiple solutions is feasible. The chart demonstrates a clear performance difference between the two methods, with GM-PRM showing a more robust and scalable approach to improving accuracy.