## Line Chart: Accuracy vs. Solutions per Problem for GM-PRM and Self-Consistency
### Overview
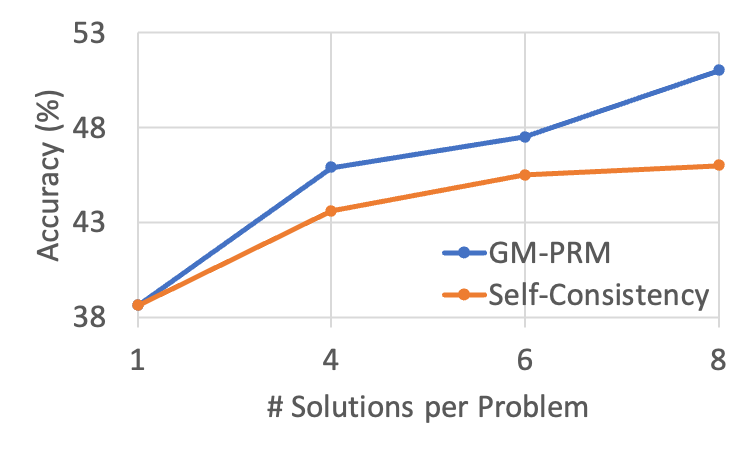
The image is a line chart comparing the performance of two methods, **GM-PRM** and **Self-Consistency**, as the number of solutions generated per problem increases. The chart plots accuracy percentage against the number of solutions, showing that both methods improve with more solutions, but at different rates.
### Components/Axes
* **Chart Type:** Line chart with markers.
* **X-Axis (Horizontal):**
* **Label:** "# Solutions per Problem"
* **Scale/Markers:** Discrete values at 1, 4, 6, and 8.
* **Y-Axis (Vertical):**
* **Label:** "Accuracy (%)"
* **Scale:** Linear scale from 38 to 53, with major gridlines at intervals of 5 (38, 43, 48, 53).
* **Legend:**
* **Position:** Bottom-right corner of the plot area.
* **Series 1:** "GM-PRM" represented by a blue line with circular markers.
* **Series 2:** "Self-Consistency" represented by an orange line with circular markers.
* **Grid:** Light gray horizontal and vertical gridlines are present.
### Detailed Analysis
**Data Series: GM-PRM (Blue Line)**
* **Trend:** The line shows a consistent, positive slope, indicating accuracy increases with more solutions per problem. The rate of increase is steepest between 1 and 4 solutions.
* **Data Points (Approximate):**
* At 1 solution: ~38.5% accuracy.
* At 4 solutions: ~46.0% accuracy.
* At 6 solutions: ~47.5% accuracy.
* At 8 solutions: ~51.0% accuracy.
**Data Series: Self-Consistency (Orange Line)**
* **Trend:** The line also shows a positive slope, but it is less steep than the GM-PRM line, especially after 4 solutions. The improvement appears to plateau slightly between 6 and 8 solutions.
* **Data Points (Approximate):**
* At 1 solution: ~38.5% accuracy (starting point identical to GM-PRM).
* At 4 solutions: ~43.5% accuracy.
* At 6 solutions: ~45.5% accuracy.
* At 8 solutions: ~46.0% accuracy.
### Key Observations
1. **Identical Starting Point:** Both methods begin at the same accuracy level (~38.5%) when only one solution is generated per problem.
2. **Diverging Performance:** The performance gap between the two methods widens as the number of solutions increases. GM-PRM consistently outperforms Self-Consistency for 4, 6, and 8 solutions.
3. **Scaling Efficiency:** GM-PRM demonstrates superior scaling. Its accuracy gain from 1 to 8 solutions is approximately 12.5 percentage points, compared to a gain of about 7.5 percentage points for Self-Consistency.
4. **Plateauing Effect:** The Self-Consistency line shows signs of diminishing returns, with minimal accuracy gain between 6 and 8 solutions (~0.5%), while GM-PRM continues a strong upward trend (~3.5% gain).
### Interpretation
The chart demonstrates that while both methods benefit from generating multiple solutions per problem (a technique often used to improve robustness in AI systems), **GM-PRM is significantly more effective at leveraging this additional computation.**
The data suggests that the GM-PRM method has a better mechanism for selecting or aggregating the correct solution from a set of candidates, as its accuracy continues to climb robustly. In contrast, the Self-Consistency method's improvement slows down, indicating it may be less efficient at utilizing the information contained in a larger set of solutions.
The key takeaway is that for tasks where generating multiple solutions is feasible, **GM-PRM is the more scalable and accurate approach** according to this evaluation. The identical starting point at one solution implies the core model or base accuracy is similar, but the method for handling multiple solutions is where the critical difference lies.