# Technical Document Extraction: Line Chart Analysis
## Chart Type
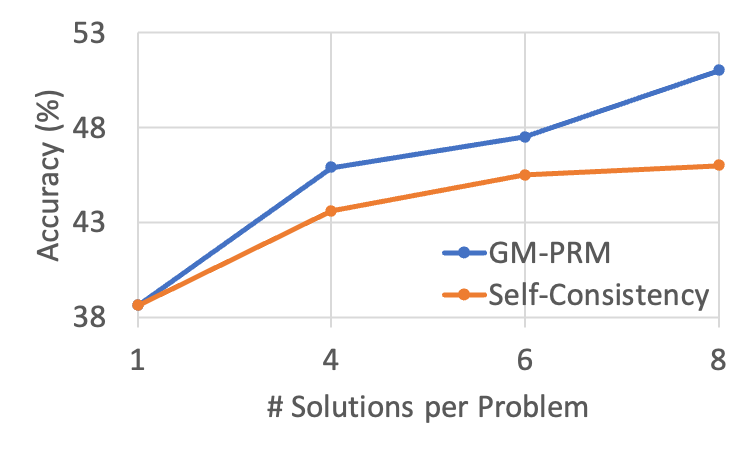
- **Line Chart** comparing two methods: GM-PRM and Self-Consistency.
## Axes Labels
- **X-Axis**: `# Solutions per Problem` (values: 1, 4, 6, 8)
- **Y-Axis**: `Accuracy (%)` (range: 38% to 53%)
## Legend
- **Location**: Right side of the chart.
- **Labels**:
- **Blue Line**: GM-PRM
- **Orange Line**: Self-Consistency
## Data Points
### GM-PRM (Blue Line)
- **Trend**: Steep upward slope.
- **Values**:
- At `# Solutions = 1`: 38%
- At `# Solutions = 4`: 46%
- At `# Solutions = 6`: 48%
- At `# Solutions = 8`: 51%
### Self-Consistency (Orange Line)
- **Trend**: Gradual upward slope.
- **Values**:
- At `# Solutions = 1`: 38%
- At `# Solutions = 4`: 43%
- At `# Solutions = 6`: 45%
- At `# Solutions = 8`: 46%
## Key Observations
1. **Initial Overlap**: Both methods start at 38% accuracy when `# Solutions = 1`.
2. **Divergence**: GM-PRM outperforms Self-Consistency across all solution counts.
3. **Slope Comparison**:
- GM-PRM exhibits a steeper increase in accuracy as `# Solutions` increases.
- Self-Consistency shows a more gradual improvement.
4. **Final Accuracy**:
- At `# Solutions = 8`, GM-PRM achieves 51% accuracy vs. 46% for Self-Consistency.
## Spatial Grounding
- **Legend Position**: Right-aligned, outside the main chart area.
- **Data Point Alignment**: All points match legend colors (blue for GM-PRM, orange for Self-Consistency).
## Trend Verification
- **GM-PRM**: Consistent upward trajectory with increasing slope.
- **Self-Consistency**: Linear growth with diminishing returns.
## Component Isolation
- **Header**: No title present.
- **Main Chart**: Grid lines for reference; no annotations.
- **Footer**: No additional text or metadata.
## Conclusion
The chart demonstrates that GM-PRM consistently outperforms Self-Consistency in accuracy as the number of solutions per problem increases. The steeper slope of GM-PRM suggests greater efficiency in leveraging additional solutions for performance gains.