## Line Graph: h_p ← pattern₀(X) ∧ region₂(X) (p = 1, r = 1)
### Overview
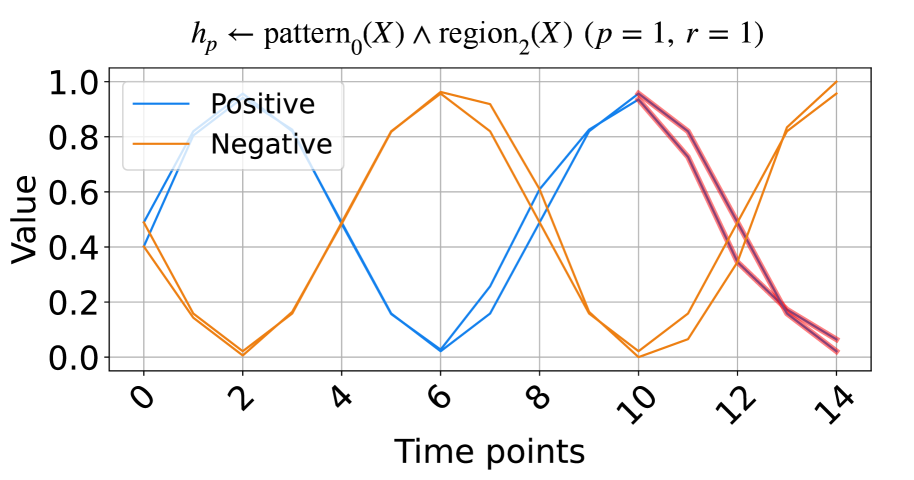
The image is a line graph depicting two oscillating data series labeled "Positive" (blue) and "Negative" (orange). The graph spans 15 time points (0–14) on the x-axis and values from 0.0 to 1.0 on the y-axis. The lines intersect multiple times, suggesting inverse relationships between the two series.
### Components/Axes
- **Title**: "h_p ← pattern₀(X) ∧ region₂(X) (p = 1, r = 1)" (top-center)
- **X-axis**: "Time points" (0–14, increments of 2)
- **Y-axis**: "Value" (0.0–1.0, increments of 0.2)
- **Legend**: Top-left corner, with:
- Blue line: "Positive"
- Orange line: "Negative"
### Detailed Analysis
1. **Positive Series (Blue)**:
- Starts at ~0.4 (time 0).
- Peaks at 1.0 (time 2).
- Drops to 0.0 (time 6).
- Rises to 1.0 (time 10).
- Falls to ~0.1 (time 14).
- **Trend**: Oscillates with peaks at even time points (2, 10) and troughs at odd multiples of 6.
2. **Negative Series (Orange)**:
- Starts at ~0.4 (time 0).
- Drops to 0.0 (time 2).
- Peaks at 1.0 (time 6).
- Drops to 0.0 (time 10).
- Rises to 1.0 (time 14).
- **Trend**: Oscillates with peaks at odd multiples of 6 (6, 14) and troughs at even time points (2, 10).
3. **Intersections**:
- Lines cross at ~time 4, 8, and 12, where values transition between positive and negative dominance.
### Key Observations
- **Inverse Relationship**: The "Positive" and "Negative" series peak at alternating time points, suggesting a cyclical opposition.
- **Symmetry**: Both series exhibit similar amplitude (0.0–1.0) but phase-shifted by 4 time units.
- **Final State**: At time 14, the "Negative" series dominates (~0.9), while "Positive" is near 0.1.
### Interpretation
The graph likely models a system where two opposing states (e.g., signal polarities, economic indicators) alternate predictably over time. The parameters `p = 1` and `r = 1` may denote a baseline configuration (e.g., periodicity or region size). The consistent oscillations imply a deterministic process, while the intersections highlight transitional states. The final dominance of the "Negative" series could indicate a long-term trend or external influence not captured by the cyclical pattern.