## Line Charts: Model Size vs. Accuracy (Naming & All Tasks)
### Overview
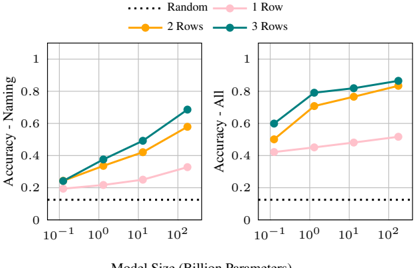
The image displays two side-by-side line charts sharing a common legend and x-axis. They plot the relationship between model size (in billion parameters) and accuracy on two different task sets: "Naming" (left chart) and "All" (right chart). The charts compare performance across four conditions: a "Random" baseline and models with 1, 2, or 3 "Rows" (likely a model architecture or training parameter).
### Components/Axes
* **Legend:** Positioned at the top center of the entire figure.
* `...... Random` (Black dotted line)
* `—●— 1 Row` (Pink line with circular markers)
* `—●— 2 Rows` (Orange line with circular markers)
* `—●— 3 Rows` (Teal line with circular markers)
* **X-Axis (Both Charts):** "Model Size (Billion Parameters)". Scale is logarithmic (base 10). Major tick marks and labels are at: `10⁻¹` (0.1), `10⁰` (1), `10¹` (10), `10²` (100).
* **Y-Axis (Left Chart):** "Accuracy - Naming". Linear scale from 0 to 1, with major ticks at 0, 0.2, 0.4, 0.6, 0.8, 1.
* **Y-Axis (Right Chart):** "Accuracy - All". Linear scale from 0 to 1, with major ticks at 0, 0.2, 0.4, 0.6, 0.8, 1.
### Detailed Analysis
**Left Chart: Accuracy - Naming**
* **Trend Verification:** All three colored lines (1, 2, 3 Rows) show a clear upward slope, indicating accuracy improves with model size. The "Random" line is flat.
* **Data Points (Approximate):**
* **Random:** Constant at ~0.1 across all model sizes.
* **1 Row (Pink):** Starts at ~0.2 (0.1B), rises to ~0.25 (1B), ~0.3 (10B), and ~0.35 (100B).
* **2 Rows (Orange):** Starts at ~0.25 (0.1B), rises to ~0.35 (1B), ~0.45 (10B), and ~0.6 (100B).
* **3 Rows (Teal):** Starts at ~0.25 (0.1B), rises to ~0.4 (1B), ~0.5 (10B), and ~0.7 (100B).
**Right Chart: Accuracy - All**
* **Trend Verification:** Similar upward trend for all colored lines, but starting from higher baseline accuracies than the "Naming" chart. The "Random" line remains flat.
* **Data Points (Approximate):**
* **Random:** Constant at ~0.1 across all model sizes.
* **1 Row (Pink):** Starts at ~0.4 (0.1B), rises to ~0.45 (1B), ~0.5 (10B), and ~0.55 (100B).
* **2 Rows (Orange):** Starts at ~0.5 (0.1B), rises to ~0.7 (1B), ~0.8 (10B), and ~0.85 (100B).
* **3 Rows (Teal):** Starts at ~0.6 (0.1B), rises to ~0.8 (1B), ~0.85 (10B), and ~0.9 (100B).
### Key Observations
1. **Consistent Hierarchy:** In both charts, the performance order is consistent: `3 Rows > 2 Rows > 1 Row > Random`. This hierarchy is maintained across all model sizes.
2. **Scaling Law:** Accuracy for the structured models (1, 2, 3 Rows) increases with model size on a log-linear plot, suggesting a power-law relationship between parameters and performance.
3. **Task Difficulty Gap:** The "Naming" task appears significantly harder than the "All" tasks aggregate. For example, at 100B parameters, the best model ("3 Rows") achieves ~0.7 on Naming vs. ~0.9 on All.
4. **Diminishing Returns:** The slope of improvement for the "2 Rows" and "3 Rows" lines appears to flatten slightly between 10B and 100B parameters, especially in the "All" chart, hinting at potential diminishing returns at very large scales.
5. **Baseline Performance:** The "Random" baseline at ~0.1 suggests the tasks have a 10% chance level accuracy (e.g., 1 in 10 choices).
### Interpretation
The data demonstrates two key findings:
1. **Architectural Efficacy:** The "Rows" parameter is a critical driver of model performance. Increasing from 1 to 3 rows yields substantial accuracy gains, more so than simply scaling model size within a given row configuration. This suggests that the structural inductive bias introduced by the "Rows" is highly beneficial for these tasks.
2. **Scalability:** Performance scales predictably with model size (billion parameters) for all non-random configurations. The charts provide empirical evidence for scaling laws in this specific context, showing that larger models are consistently better, though the rate of improvement may vary by task and architecture.
The stark difference between the "Naming" and "All" charts implies that the "Naming" task is a specific, challenging subset where architectural choices ("Rows") have a pronounced effect. The "All" metric, likely an average over multiple tasks, shows higher overall performance but follows the same relative trends. The consistent gap above the "Random" line confirms that the models are learning meaningful patterns, not guessing.