## Line Graphs: Model Size vs. Accuracy Across Different Configurations
### Overview
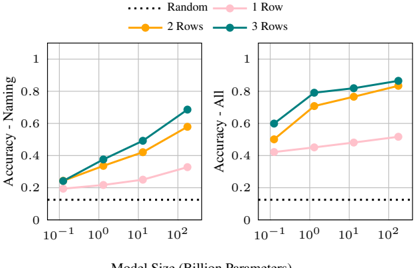
The image contains two line graphs comparing model accuracy against model size (in billion parameters). The left graph focuses on "Naming" accuracy, while the right graph measures "All" accuracy. Both graphs show trends across model sizes (10⁻¹ to 10²) for four configurations: Random (dotted line), 1 Row (pink), 2 Rows (orange), and 3 Rows (teal).
---
### Components/Axes
- **X-axis (Horizontal)**: Model Size (Billion Parameters)
- Logarithmic scale: 10⁻¹, 10⁰, 10¹, 10²
- **Y-axis (Vertical)**: Accuracy (0 to 1)
- **Legends**:
- Top-left placement
- Labels:
- `Random` (dotted black line)
- `1 Row` (pink line with circles)
- `2 Rows` (orange line with circles)
- `3 Rows` (teal line with circles)
---
### Detailed Analysis
#### Left Graph: Accuracy - Naming
- **Trends**:
- All configurations show upward trends as model size increases.
- `3 Rows` (teal) consistently outperforms others.
- `Random` (dotted) remains flat at ~0.1.
- **Data Points (approximate)**:
- **10⁻¹**:
- `Random`: 0.1
- `1 Row`: 0.2
- `2 Rows`: 0.25
- `3 Rows`: 0.25
- **10⁰**:
- `Random`: 0.1
- `1 Row`: 0.22
- `2 Rows`: 0.35
- `3 Rows`: 0.38
- **10¹**:
- `Random`: 0.1
- `1 Row`: 0.28
- `2 Rows`: 0.45
- `3 Rows`: 0.52
- **10²**:
- `Random`: 0.1
- `1 Row`: 0.32
- `2 Rows`: 0.58
- `3 Rows`: 0.68
#### Right Graph: Accuracy - All
- **Trends**:
- All configurations improve with model size, but gaps narrow at larger scales.
- `3 Rows` (teal) maintains the highest accuracy.
- `Random` (dotted) remains flat at ~0.2.
- **Data Points (approximate)**:
- **10⁻¹**:
- `Random`: 0.2
- `1 Row`: 0.4
- `2 Rows`: 0.5
- `3 Rows`: 0.6
- **10⁰**:
- `Random`: 0.2
- `1 Row`: 0.42
- `2 Rows`: 0.7
- `3 Rows`: 0.78
- **10¹**:
- `Random`: 0.2
- `1 Row`: 0.45
- `2 Rows`: 0.75
- `3 Rows`: 0.8
- **10²**:
- `Random`: 0.2
- `1 Row`: 0.48
- `2 Rows`: 0.8
- `3 Rows`: 0.82
---
### Key Observations
1. **Model Size Impact**:
- Larger models (10²) outperform smaller ones across all configurations.
- `3 Rows` achieves the highest accuracy in both graphs (~0.68 for Naming, ~0.82 for All).
2. **Configuration Differences**:
- `3 Rows` consistently outperforms `2 Rows` and `1 Row` by ~10–20% in both metrics.
- `Random` models show minimal improvement (~0.1–0.2 accuracy), suggesting baseline performance is low.
3. **Diminishing Returns**:
- At 10² model size, accuracy gains between configurations shrink (e.g., `3 Rows` vs. `2 Rows` gap narrows from 0.16 at 10⁰ to 0.02 at 10²).
---
### Interpretation
- **Technical Insight**:
- Increasing model size improves accuracy, but the benefit diminishes at larger scales.
- The `3 Rows` configuration likely represents a more complex or optimized architecture, justifying its superior performance.
- **Practical Implications**:
- For resource-constrained scenarios, smaller models with fewer rows (e.g., `1 Row`) may suffice if accuracy requirements are modest.
- The `Random` line’s flat trend highlights the importance of intentional model design over brute-force scaling.
- **Anomalies**:
- The `Random` line’s slight upward trend in the "All" graph (~0.2 to 0.2) may indicate minor overfitting or noise in the dataset.
---
### Language Note
All text in the image is in English. No non-English content is present.