## Horizontal Grouped Bar Chart: Model Performance Metrics
### Overview
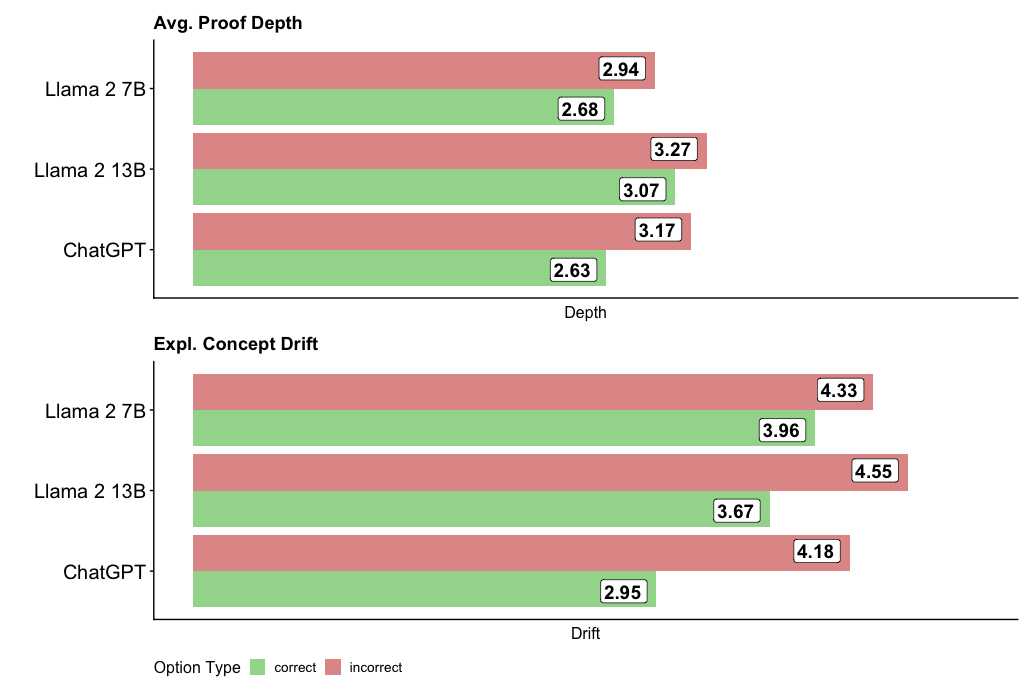
The image displays two horizontal grouped bar charts comparing the performance of three large language models (LLMs) on two distinct metrics: "Avg. Proof Depth" and "Expl. Concept Drift." Each chart compares the models' performance on "correct" versus "incorrect" options or outputs. The overall design is clean, with a white background and clear numerical labels on each bar.
### Components/Axes
* **Chart 1 (Top):** Titled "Avg. Proof Depth".
* **Y-axis (Categories):** Lists three models: "Llama 2 7B", "Llama 2 13B", and "ChatGPT".
* **X-axis (Measure):** Labeled "Depth". The axis line is present, but no numerical tick marks are shown; values are provided directly on the bars.
* **Chart 2 (Bottom):** Titled "Expl. Concept Drift".
* **Y-axis (Categories):** Same three models as above.
* **X-axis (Measure):** Labeled "Drift". Similar to the first chart, no numerical ticks are present.
* **Legend:** Positioned at the bottom center of the entire image. It defines the color coding for the bars:
* **Green Square:** "correct"
* **Red Square:** "incorrect"
* **Data Labels:** Each bar has a white box at its end containing the precise numerical value for that data point.
### Detailed Analysis
#### Chart 1: Avg. Proof Depth
This chart measures the average depth of proofs or reasoning chains. For each model, the red bar (incorrect) is longer than the green bar (correct).
* **Llama 2 7B:**
* Incorrect (Red): 2.94
* Correct (Green): 2.68
* **Llama 2 13B:**
* Incorrect (Red): 3.27
* Correct (Green): 3.07
* **ChatGPT:**
* Incorrect (Red): 3.17
* Correct (Green): 2.63
**Trend Verification:** Across all three models, the "incorrect" outputs have a higher average proof depth than the "correct" outputs. The Llama 2 13B model shows the highest depth values for both categories.
#### Chart 2: Expl. Concept Drift
This chart measures the extent of "explained concept drift," likely indicating how much the model's explanation deviates from a core concept. The pattern mirrors the first chart: red bars (incorrect) are consistently longer than green bars (correct).
* **Llama 2 7B:**
* Incorrect (Red): 4.33
* Correct (Green): 3.96
* **Llama 2 13B:**
* Incorrect (Red): 4.55
* Correct (Green): 3.67
* **ChatGPT:**
* Incorrect (Red): 4.18
* Correct (Green): 2.95
**Trend Verification:** The "incorrect" outputs exhibit greater concept drift than the "correct" ones for every model. The Llama 2 13B model again shows the highest value for the "incorrect" category. ChatGPT shows the largest disparity between its correct and incorrect drift scores.
### Key Observations
1. **Consistent Pattern:** In both metrics, incorrect model outputs are associated with higher numerical values (deeper proofs, greater drift) than correct outputs.
2. **Model Comparison:** Llama 2 13B tends to have the highest values in the "incorrect" category for both metrics (3.27 depth, 4.55 drift).
3. **Largest Discrepancy:** The most significant gap between correct and incorrect performance is seen in ChatGPT's "Expl. Concept Drift" score (4.18 vs. 2.95, a difference of 1.23).
4. **Smallest Discrepancy:** The smallest gap is in Llama 2 13B's "Avg. Proof Depth" (3.27 vs. 3.07, a difference of 0.20).
### Interpretation
The data suggests a counterintuitive but potentially significant relationship: **incorrect or flawed model outputs are characterized by longer, more complex reasoning chains (higher proof depth) and explanations that deviate more from the central concept (higher concept drift).**
This could imply that when these models err, they don't simply give short, wrong answers. Instead, they may engage in more elaborate but misguided reasoning, constructing longer justifications that ultimately stray from the correct conceptual path. The higher "drift" score for incorrect answers supports this, indicating a loss of focus on the core idea.
The consistent pattern across three different models (two sizes of Llama 2 and ChatGPT) suggests this might be a general characteristic of current LLM failure modes. From a diagnostic perspective, monitoring for unusually long proof chains or high concept drift in a model's output could serve as a potential red flag for low confidence or likely incorrectness. The outlier is ChatGPT's correct concept drift (2.95), which is notably lower than its peers, possibly indicating a different internal mechanism for maintaining conceptual focus when it is correct.