## Bar Charts: Avg. Proof Depth and Expl. Concept Drift
### Overview
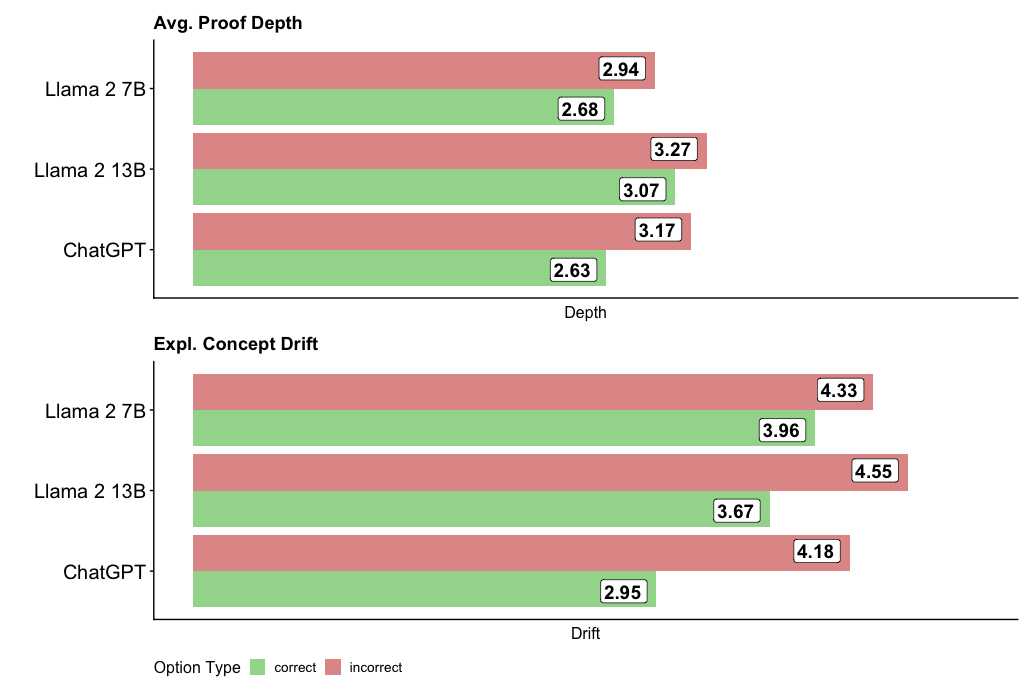
The image contains two vertically stacked bar charts comparing three language models (Llama 2 7B, Llama 2 13B, ChatGPT) across two metrics: "Avg. Proof Depth" (top) and "Expl. Concept Drift" (bottom). Each chart uses color-coded bars (green = correct, red = incorrect) to represent performance metrics.
### Components/Axes
- **X-Axes**:
- Top Chart: "Depth" (numerical scale)
- Bottom Chart: "Drift" (numerical scale)
- **Y-Axes**:
- Categories: Llama 2 7B (top), Llama 2 13B (middle), ChatGPT (bottom)
- **Legend**:
- Position: Bottom center
- Labels:
- Green = "correct"
- Red = "incorrect"
### Detailed Analysis
#### Avg. Proof Depth (Top Chart)
- **Llama 2 7B**:
- Incorrect (red): 2.94
- Correct (green): 2.68
- **Llama 2 13B**:
- Incorrect (red): 3.27
- Correct (green): 3.07
- **ChatGPT**:
- Incorrect (red): 3.17
- Correct (green): 2.63
#### Expl. Concept Drift (Bottom Chart)
- **Llama 2 7B**:
- Incorrect (red): 4.33
- Correct (green): 3.96
- **Llama 2 13B**:
- Incorrect (red): 4.55
- Correct (green): 3.67
- **ChatGPT**:
- Incorrect (red): 4.18
- Correct (green): 2.95
### Key Observations
1. **Consistent Pattern**: Incorrect options (red bars) consistently show higher values than correct options (green bars) in both metrics across all models.
2. **Model Comparison**:
- Llama 2 7B has the highest values for both metrics (incorrect: 2.94/4.33; correct: 2.68/3.96).
- ChatGPT has the lowest values for both metrics (incorrect: 3.17/4.18; correct: 2.63/2.95).
3. **Drift vs. Depth**: Expl. Concept Drift values are uniformly higher than Avg. Proof Depth values for corresponding options.
### Interpretation
The data suggests that:
- **Incorrect options** require deeper cognitive processing (higher proof depth) and exhibit greater concept drift compared to correct options.
- Llama 2 7B demonstrates the most significant disparity between correct and incorrect options, indicating potential inefficiencies in handling erroneous inputs.
- ChatGPT shows the smallest gaps between correct and incorrect metrics, suggesting more robust performance across both dimensions.
- The consistent red-green value hierarchy implies that model architectures may inherently struggle more with incorrect than correct options, regardless of size (7B vs. 13B parameters).