\n
## Diagram: Network Graph
### Overview
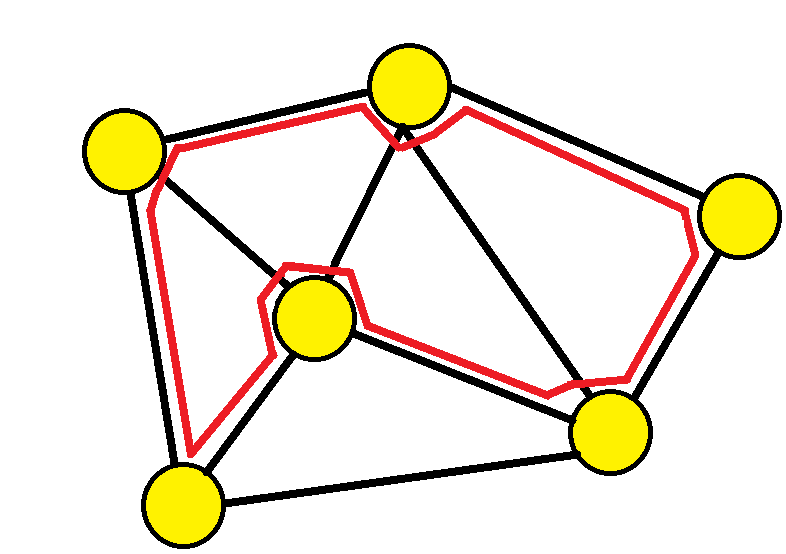
The image depicts a network graph consisting of seven nodes (represented by yellow circles) connected by edges (lines). There are two distinct sets of edges: black and red. The graph appears to be planar, meaning it can be drawn on a plane without any edges crossing.
### Components/Axes
There are no explicit axes or labels in the image. The components are:
* **Nodes:** Seven yellow circles.
* **Edges:** Black and red lines connecting the nodes.
### Detailed Analysis or Content Details
The graph can be described as follows:
1. **Node Arrangement:** The nodes are arranged in a roughly hexagonal shape, with one node positioned slightly inside the hexagon.
2. **Black Edges:** The black edges form a triangular structure connecting three nodes on the outer perimeter of the hexagon.
3. **Red Edges:** The red edges form a more complex, roughly hexagonal path connecting all seven nodes. The red edges create a closed loop encompassing all nodes.
4. **Node Connectivity:**
* The top-left node is connected to the top-center node and the bottom-left node via red edges.
* The top-center node is connected to the top-right node and the bottom-center node via red edges.
* The top-right node is connected to the bottom-right node via a red edge.
* The bottom-right node is connected to the bottom-center node via a red edge.
* The bottom-center node is connected to the bottom-left node via a red edge.
* The bottom-left node is connected to the inner node via a red edge.
* The inner node is connected to the top-left node via a red edge.
* The bottom-left, bottom-center, and bottom-right nodes are connected by black edges forming a triangle.
### Key Observations
* The red edges create a complete cycle, connecting all nodes in a closed loop.
* The black edges form a smaller, isolated triangle within the larger network.
* The inner node is only connected to the outer nodes via red edges.
* The graph is relatively simple, with a clear distinction between the two types of edges.
### Interpretation
The diagram likely represents a network or system where nodes represent entities and edges represent relationships between them. The two colors of edges could signify different types of relationships. For example:
* **Red Edges:** Might represent strong or primary connections, or a flow of resources/information. The closed loop suggests a self-contained system or a cycle of interactions.
* **Black Edges:** Might represent weaker or secondary connections, or a specific type of interaction that is limited to a subset of the nodes. The triangular structure could represent a stable or foundational relationship.
The placement of the inner node, connected only by red edges, suggests it plays a central role in the network, acting as a hub or intermediary. The overall structure suggests a system with both interconnected and isolated components. Without further context, it's difficult to determine the specific meaning of the network, but the diagram provides a visual representation of its structure and relationships. The diagram does not provide any quantitative data, only a qualitative representation of connections.