## Diagram: Network Topology Illustration
### Overview
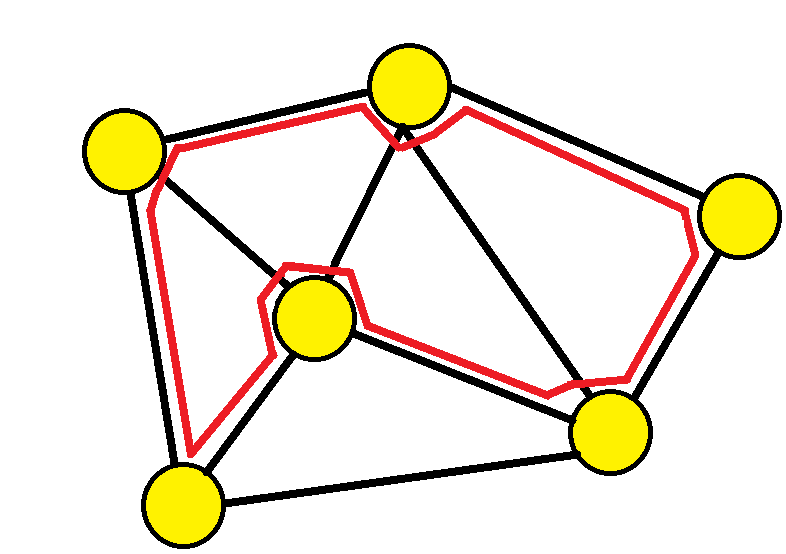
The image depicts a network topology diagram with five yellow circular nodes connected by black and red lines. No textual labels, legends, or axis markers are present.
### Components/Axes
- **Nodes**: Five yellow circles (no labels or identifiers).
- **Edges**:
- Black lines: Primary connections between nodes.
- Red lines: Highlighted path (e.g., between nodes 1→2→3→4→5).
- **No legends, axis titles, or textual annotations** are visible.
### Detailed Analysis
- **Node Placement**:
- Nodes are arranged in a roughly linear sequence (left to right: Node 1, Node 2, Node 3, Node 4, Node 5).
- Node 3 is centrally located, acting as a hub with multiple connections.
- **Edge Patterns**:
- Black lines form a complete graph (all nodes interconnected).
- Red lines trace a specific route: Node 1 → Node 2 → Node 3 → Node 4 → Node 5.
- **No numerical values, scales, or categorical labels** are present.
### Key Observations
1. The red-highlighted path suggests a prioritized or critical route within the network.
2. Node 3’s central position implies it may serve as a primary relay or junction point.
3. The absence of labels or legends prevents identification of nodes or edge types (e.g., data flow, latency, bandwidth).
### Interpretation
This diagram likely represents a simplified network architecture, emphasizing connectivity and a specific traversal path. The lack of textual details limits quantitative analysis but highlights structural relationships:
- **Central Hub**: Node 3’s role as a connector suggests it is critical for network resilience or efficiency.
- **Red Path Significance**: The red edges may indicate a fail-safe route, primary data flow, or a vulnerability (e.g., single points of failure).
- **Complete Graph**: The black lines imply full mesh connectivity, which is resource-intensive but maximizes redundancy.
No numerical data or categorical labels are available for further analysis. The diagram focuses on visualizing topology rather than quantitative metrics.