## Chart: AlphaEvolve Constructions - Min/Max |p(z)| / sqrt(n+1) vs. Degree
### Overview
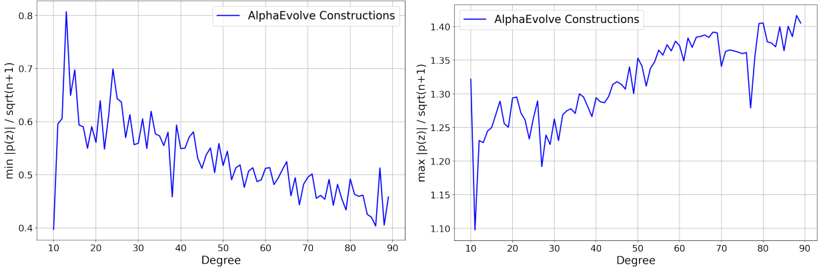
The image presents two line charts side-by-side, both displaying data related to "AlphaEvolve Constructions." The left chart shows the minimum value of |p(z)| / sqrt(n+1) against the degree, while the right chart shows the maximum value of the same expression against the degree. Both charts share the same x-axis, representing the degree, ranging from approximately 5 to 90.
### Components/Axes
**Left Chart:**
* **Title:** "min |p(z)| / sqrt(n+1)"
* **Y-axis:** "min |p(z)| / sqrt(n+1)" with a scale from 0.4 to 0.8.
* **X-axis:** "Degree" with a scale from 10 to 90, incrementing by 10.
* **Legend:** "AlphaEvolve Constructions" (blue line). Located in the top-right corner.
**Right Chart:**
* **Title:** "max |p(z)| / sqrt(n+1)"
* **Y-axis:** "max |p(z)| / sqrt(n+1)" with a scale from 1.10 to 1.40.
* **X-axis:** "Degree" with a scale from 10 to 90, incrementing by 10.
* **Legend:** "AlphaEvolve Constructions" (blue line). Located in the top-left corner.
### Detailed Analysis
**Left Chart (Minimum Value):**
* **Trend:** The blue line, representing "AlphaEvolve Constructions," initially rises sharply from degree 5 to a peak around degree 12, then generally decreases with fluctuations as the degree increases.
* **Data Points:**
* Degree 10: approximately 0.6
* Degree 12: approximately 0.8
* Degree 20: approximately 0.6
* Degree 40: approximately 0.55
* Degree 60: approximately 0.5
* Degree 80: approximately 0.45
* Degree 90: approximately 0.5
**Right Chart (Maximum Value):**
* **Trend:** The blue line, representing "AlphaEvolve Constructions," rises sharply from degree 5 to a peak around degree 12, then generally increases with fluctuations as the degree increases.
* **Data Points:**
* Degree 10: approximately 1.1
* Degree 12: approximately 1.23
* Degree 20: approximately 1.28
* Degree 40: approximately 1.29
* Degree 60: approximately 1.3
* Degree 80: approximately 1.36
* Degree 90: approximately 1.34
### Key Observations
* Both charts show significant fluctuations in the values of min/max |p(z)| / sqrt(n+1) across different degrees.
* The minimum value generally decreases with increasing degree, while the maximum value generally increases.
* There is a sharp initial rise in both minimum and maximum values between degree 5 and 12.
### Interpretation
The charts illustrate the behavior of the minimum and maximum values of |p(z)| / sqrt(n+1) for "AlphaEvolve Constructions" as the degree changes. The contrasting trends suggest that while the minimum possible value tends to decrease with higher degrees, the maximum possible value tends to increase. The initial sharp rise in both values indicates a significant change in behavior at lower degrees. The fluctuations in both charts suggest that the relationship between the degree and the values is not linear and may be influenced by other factors. The data suggests that the range of possible values for |p(z)| / sqrt(n+1) widens as the degree increases.