## Line Charts: AlphaEvolve Constructions - Minimum and Maximum Values
### Overview
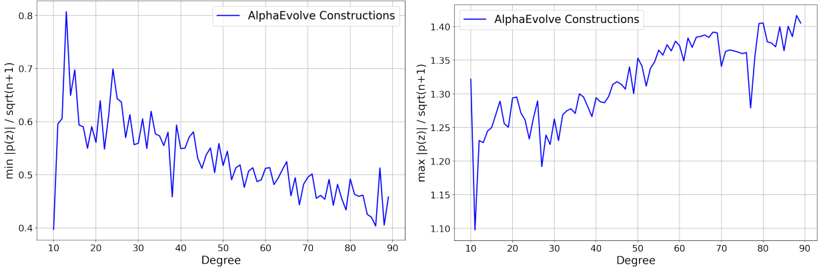
The image presents two line charts side-by-side, both depicting the relationship between "Degree" and a normalized value related to the magnitude of a vector 'p(z)'. The left chart shows the minimum value of |p(z)| / sqrt(n+1) while the right chart shows the maximum value. Both charts share the same x-axis (Degree) and are labeled "AlphaEvolve Constructions".
### Components/Axes
* **X-axis:** "Degree", ranging from approximately 0 to 90. The axis is linearly scaled with markers at 10, 20, 30, 40, 50, 60, 70, 80, and 90.
* **Left Y-axis:** "min |p(z)| / sqrt(n+1)", ranging from approximately 0.4 to 0.8.
* **Right Y-axis:** "max |p(z)| / sqrt(n+1)", ranging from approximately 1.1 to 1.4.
* **Line:** A single blue line is present in both charts, labeled "AlphaEvolve Constructions" in the top-left corner of the left chart.
### Detailed Analysis or Content Details
**Left Chart (Minimum Value):**
The line starts at approximately 0.75 at Degree 0, rapidly drops to a minimum of approximately 0.42 at Degree 8, then fluctuates between approximately 0.55 and 0.65 until Degree 40. From Degree 40 to 80, the line generally decreases, reaching a value of approximately 0.5 at Degree 80. There are several local minima and maxima within this range.
* Degree 0: ~0.75
* Degree 8: ~0.42 (minimum)
* Degree 16: ~0.58
* Degree 24: ~0.62
* Degree 32: ~0.57
* Degree 40: ~0.55
* Degree 50: ~0.53
* Degree 60: ~0.52
* Degree 70: ~0.51
* Degree 80: ~0.50
* Degree 90: ~0.53
**Right Chart (Maximum Value):**
The line starts at approximately 1.25 at Degree 0, drops to a minimum of approximately 1.18 at Degree 10, then generally increases with fluctuations until Degree 80, reaching a maximum of approximately 1.4 at Degree 80. There is a sharp drop to approximately 1.32 at Degree 90.
* Degree 0: ~1.25
* Degree 10: ~1.18 (minimum)
* Degree 20: ~1.28
* Degree 30: ~1.32
* Degree 40: ~1.34
* Degree 50: ~1.36
* Degree 60: ~1.37
* Degree 70: ~1.39
* Degree 80: ~1.40 (maximum)
* Degree 90: ~1.32
### Key Observations
* The minimum value of |p(z)| / sqrt(n+1) generally decreases as the degree increases, with significant fluctuations.
* The maximum value of |p(z)| / sqrt(n+1) generally increases as the degree increases, also with fluctuations.
* Both charts exhibit a degree of volatility, suggesting a complex relationship between the degree and the magnitude of p(z).
* The maximum value is consistently higher than the minimum value, as expected.
* Both charts show a sharp change in slope around Degree 10.
### Interpretation
The charts likely represent the behavior of a function or algorithm (AlphaEvolve Constructions) as a parameter ("Degree") is varied. The minimum and maximum values of |p(z)| / sqrt(n+1) provide bounds on the output of this function. The decreasing trend in the minimum value suggests that the function's output tends to become smaller in magnitude as the degree increases. Conversely, the increasing trend in the maximum value suggests that the function's output can become larger in magnitude as the degree increases.
The fluctuations in both charts indicate that the relationship is not strictly monotonic. The sharp change in slope around Degree 10 could indicate a critical point or a change in the function's behavior. The fact that both charts are normalized by sqrt(n+1) suggests that the magnitude of p(z) is being compared relative to the size of the input data (n). Without further context, it's difficult to determine the specific meaning of "Degree" and "p(z)", but the charts provide valuable insights into the function's behavior and its sensitivity to changes in the degree parameter.