## Line Charts: AlphaEvolve Constructions - Minimum and Maximum Normalized Polynomial Magnitude vs. Degree
### Overview
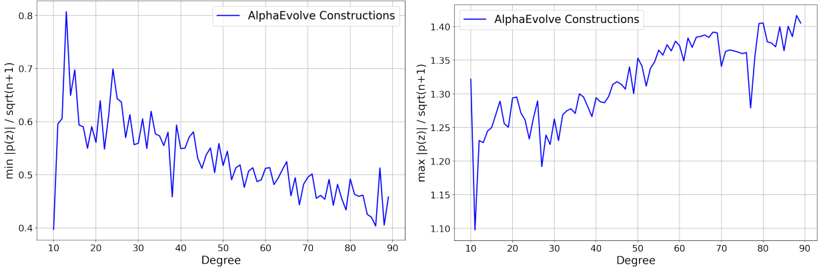
The image contains two side-by-side line charts. Both charts plot a metric related to "AlphaEvolve Constructions" against "Degree" on the x-axis. The left chart displays the **minimum** value of a normalized polynomial magnitude, while the right chart displays the **maximum** value of the same normalized metric. The data suggests an analysis of polynomial behavior or construction quality across a range of degrees (10 to 90).
### Components/Axes
* **Chart Type:** Two separate line charts.
* **Legend:** A single legend entry, "AlphaEvolve Constructions," is present at the top-center of each chart's plotting area, indicated by a solid blue line.
* **X-Axis (Both Charts):**
* **Label:** "Degree"
* **Scale:** Linear, ranging from 10 to 90.
* **Major Ticks:** Marked at intervals of 10 (10, 20, 30, 40, 50, 60, 70, 80, 90).
* **Y-Axis (Left Chart):**
* **Label:** "min |p(z)| / sqrt(n+1)"
* **Scale:** Linear, ranging from approximately 0.4 to 0.8.
* **Major Ticks:** Marked at 0.4, 0.5, 0.6, 0.7, 0.8.
* **Y-Axis (Right Chart):**
* **Label:** "max |p(z)| / sqrt(n+1)"
* **Scale:** Linear, ranging from approximately 1.10 to 1.40.
* **Major Ticks:** Marked at 1.10, 1.15, 1.20, 1.25, 1.30, 1.35, 1.40.
### Detailed Analysis
#### Left Chart: Minimum Value Trend
* **Trend Verification:** The blue line representing the minimum value shows high initial volatility followed by a general downward trend as degree increases.
* **Data Points & Spatial Grounding:**
* At **Degree 10**, the value starts near the bottom of the axis, approximately **0.40**.
* A sharp spike occurs early, reaching the chart's peak of approximately **0.81** at around **Degree 12**.
* Following this peak, the line exhibits significant jagged fluctuations but follows a clear downward trajectory.
* By **Degree 50**, the value has decreased to approximately **0.55**.
* The decline continues with persistent volatility. At **Degree 70**, the value is near **0.48**.
* The chart ends at **Degree 90** with a value of approximately **0.42**.
#### Right Chart: Maximum Value Trend
* **Trend Verification:** The blue line representing the maximum value shows an overall upward trend with moderate volatility as degree increases.
* **Data Points & Spatial Grounding:**
* At **Degree 10**, the value starts at a local minimum of approximately **1.10**.
* It rises quickly, reaching approximately **1.23** by **Degree 15**.
* The line continues an upward climb with noticeable dips and recoveries. A significant dip occurs around **Degree 28**, dropping to approximately **1.20**.
* By **Degree 50**, the value has risen to approximately **1.32**.
* The upward trend persists. At **Degree 70**, the value is near **1.38**.
* The chart ends at **Degree 90** with a value of approximately **1.41**, near the top of the axis.
### Key Observations
1. **Inverse Relationship:** The two charts demonstrate an inverse relationship. As the degree increases, the *minimum* normalized magnitude generally **decreases**, while the *maximum* normalized magnitude generally **increases**.
2. **Volatility:** Both metrics are highly volatile, showing jagged, non-smooth progression across degrees. The minimum value chart appears more volatile, especially at lower degrees.
3. **Range Expansion:** The spread between the minimum and maximum values widens significantly with degree. At Degree 10, the spread is ~0.70 (1.10 - 0.40). By Degree 90, the spread has grown to ~0.99 (1.41 - 0.42).
4. **No Convergence:** The data does not suggest convergence of the min and max values; instead, they diverge.
### Interpretation
The charts likely analyze the performance or properties of a mathematical construction method called "AlphaEvolve," possibly for generating polynomials `p(z)`. The metric `|p(z)| / sqrt(n+1)` is a normalized measure of the polynomial's magnitude.
* **What the data suggests:** The method produces polynomials whose **minimum** magnitude (the smallest value it takes on) tends to get smaller relative to the normalization factor as the polynomial's degree (`n`) increases. Conversely, the **maximum** magnitude tends to get larger. This indicates that as the polynomials become higher-degree (more complex), their range of values expands—they can achieve both smaller minima and larger maxima.
* **Why it matters:** This behavior is critical in fields like approximation theory, signal processing, or numerical analysis. A widening min-max spread could imply increased sensitivity, greater potential for approximation error, or a larger dynamic range in the polynomial's output. The volatility suggests the construction method's output is sensitive to the specific degree chosen.
* **Peircean Investigative Reading:** The divergence is the key pattern. One might hypothesize that the AlphaEvolve construction prioritizes some other property (like orthogonality or specific root placement) at the expense of controlling the overall magnitude range. The charts serve as a diagnostic tool, revealing a fundamental trade-off in the method's behavior as complexity (degree) scales. The lack of smoothness indicates the process is not analytically simple and may involve discrete or combinatorial choices at each degree.