## Line Graphs: AlphaEvolve Constructions Metrics by Degree
### Overview
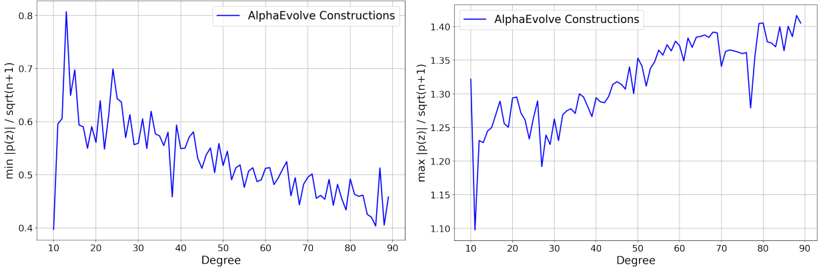
Two line graphs compare metrics labeled "AlphaEvolve Constructions" across degrees 10–90. The left graph shows the minimum normalized probability (`min |p(z)| / sqrt(n+1)`), while the right graph shows the maximum normalized probability (`max |p(z)| / sqrt(n+1)`). Both graphs exhibit volatility but diverge in long-term trends.
---
### Components/Axes
- **X-axis (Shared)**:
- Label: "Degree"
- Scale: 10 to 90 in increments of 10.
- **Left Y-axis**:
- Label: `min |p(z)| / sqrt(n+1)`
- Scale: 0.4 to 0.8.
- **Right Y-axis**:
- Label: `max |p(z)| / sqrt(n+1)`
- Scale: 1.1 to 1.4.
- **Legend**:
- Position: Top-right of each graph.
- Label: "AlphaEvolve Constructions" (blue line).
---
### Detailed Analysis
#### Left Graph (`min |p(z)| / sqrt(n+1)`)
- **Initial Drop**:
- At Degree 10, the value starts at ~0.8.
- Sharp decline to ~0.4 by Degree 20.
- **Fluctuations**:
- Post-Degree 20, the line oscillates between ~0.4 and ~0.6.
- Notable peaks at Degrees 30 (~0.65), 40 (~0.55), and 80 (~0.55).
- **Final Value**:
- Ends at ~0.45 at Degree 90.
#### Right Graph (`max |p(z)| / sqrt(n+1)`)
- **Initial Value**:
- Starts at ~1.35 at Degree 10.
- **Upward Trend**:
- Gradual increase to ~1.4 by Degree 90.
- Sharp peaks at Degrees 20 (~1.3), 50 (~1.35), and 85 (~1.4).
- **Volatility**:
- Dips to ~1.15 at Degrees 30 and 70.
---
### Key Observations
1. **Left Graph**:
- Sharp initial decline followed by stabilization with minor fluctuations.
- No clear long-term trend after Degree 20.
2. **Right Graph**:
- Consistent upward trend despite volatility.
- Peaks correlate with Degrees 20, 50, and 85.
3. **Divergence**:
- Left graph decreases initially, while the right graph increases.
- Both graphs share similar volatility patterns but differ in magnitude.
---
### Interpretation
- **Left Graph**:
- The initial drop at low degrees suggests a sensitivity to early-stage parameters or constraints.
- Stabilization at lower values (post-Degree 20) may indicate a saturation or equilibrium in the system.
- **Right Graph**:
- The upward trend implies increasing variability or complexity in the system as degree grows.
- Peaks at Degrees 20, 50, and 85 could reflect critical thresholds or phase transitions.
- **Relationship**:
- The inverse relationship between `min` and `max` values suggests a trade-off between stability (lower `min`) and variability (higher `max`) in the AlphaEvolve Constructions.
- The shared volatility across both graphs indicates inherent instability in the system across all degrees.
This analysis highlights how the AlphaEvolve Constructions balance between minimizing risk (left graph) and maximizing potential (right graph), with degree acting as a key driver of system behavior.