## Diagram: Cognitive Brain vs. Chain-of-Thought
### Overview
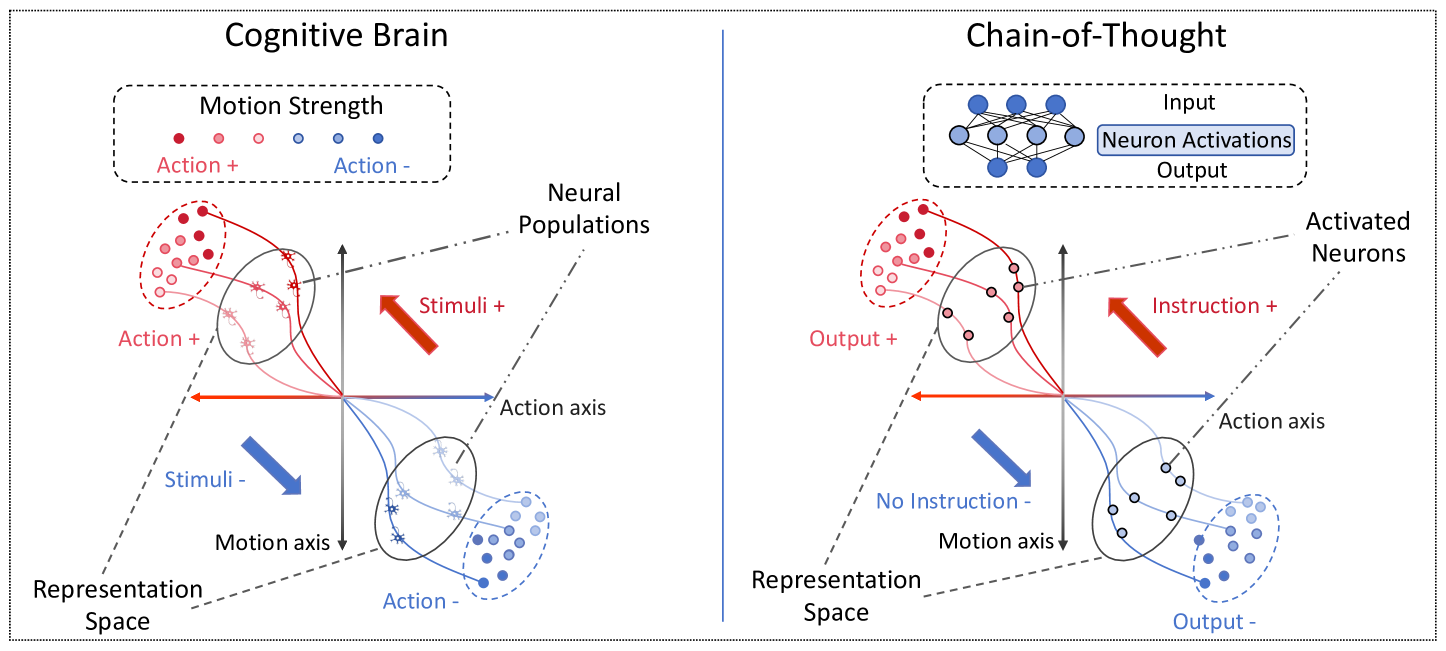
The image presents two diagrams side-by-side, illustrating conceptual models of "Cognitive Brain" and "Chain-of-Thought." Both diagrams use a 3D representation space with axes labeled "Action axis" and "Motion axis." They depict neural populations and their activation patterns in response to stimuli or instructions. The diagrams use color-coding to represent positive and negative actions/outputs.
### Components/Axes
**Left Diagram (Cognitive Brain):**
* **Title:** Cognitive Brain
* **Axes:**
* Action axis (horizontal)
* Motion axis (vertical)
* **Representation Space:** The 3D space defined by the axes.
* **Neural Populations:** Clusters of dots, color-coded.
* **Motion Strength Legend:** Located at the top-left.
* Red dots: Action +
* Blue dots: Action -
* **Stimuli Arrows:**
* Red arrow pointing up and to the right: Stimuli +
* Blue arrow pointing down and to the left: Stimuli -
* **Labels:**
* Action + (near the red neural population)
* Action - (near the blue neural population)
**Right Diagram (Chain-of-Thought):**
* **Title:** Chain-of-Thought
* **Axes:**
* Action axis (horizontal)
* Motion axis (vertical)
* **Representation Space:** The 3D space defined by the axes.
* **Neural Populations:** Clusters of dots, color-coded.
* **Neuron Activations:** A small neural network diagram at the top, labeled with "Input," "Neuron Activations" (in a blue box), and "Output."
* **Instruction Arrow:**
* Red arrow pointing up and to the right: Instruction +
* **Labels:**
* Output + (near the red neural population)
* Output - (near the blue neural population)
* No Instruction - (near the blue arrow)
* **Activated Neurons:** Label for the neural populations.
### Detailed Analysis
**Left Diagram (Cognitive Brain):**
* **Action + Neural Population:** Located in the top-left quadrant. The dots are red, indicating positive action. The motion strength varies from dark red to light red.
* **Action - Neural Population:** Located in the bottom-right quadrant. The dots are blue, indicating negative action. The motion strength varies from dark blue to light blue.
* **Stimuli + Arrow:** A red arrow pointing towards the top-right, indicating positive stimuli.
* **Stimuli - Arrow:** A blue arrow pointing towards the bottom-left, indicating negative stimuli.
**Right Diagram (Chain-of-Thought):**
* **Output + Neural Population:** Located in the top-left quadrant. The dots are red, indicating positive output.
* **Output - Neural Population:** Located in the bottom-right quadrant. The dots are blue, indicating negative output.
* **Instruction + Arrow:** A red arrow pointing towards the top-right, indicating positive instruction.
* **Neuron Activations Diagram:** Shows a simple neural network with interconnected nodes.
### Key Observations
* Both diagrams use a similar 3D representation space with "Action" and "Motion" axes.
* The Cognitive Brain diagram focuses on stimuli and actions, while the Chain-of-Thought diagram focuses on instructions and outputs.
* Color-coding (red and blue) is used consistently to represent positive and negative values.
* The Chain-of-Thought diagram includes a neural network representation, suggesting a more complex processing model.
### Interpretation
The diagrams illustrate two different models of brain function. The "Cognitive Brain" model emphasizes the role of external stimuli in driving actions, while the "Chain-of-Thought" model highlights the internal processing of instructions to generate outputs. The "Chain-of-Thought" diagram, with its neural network component, suggests a more sophisticated, multi-layered processing approach compared to the more direct stimulus-response model of the "Cognitive Brain." The spatial arrangement of neural populations in relation to the axes and stimuli/instructions suggests a mapping of neural activity within the representation space. The motion strength, indicated by the color gradient, could represent the intensity or confidence of the action/output.