## Diagram: Cognitive Brain and Chain-of-Thought Processing
### Overview
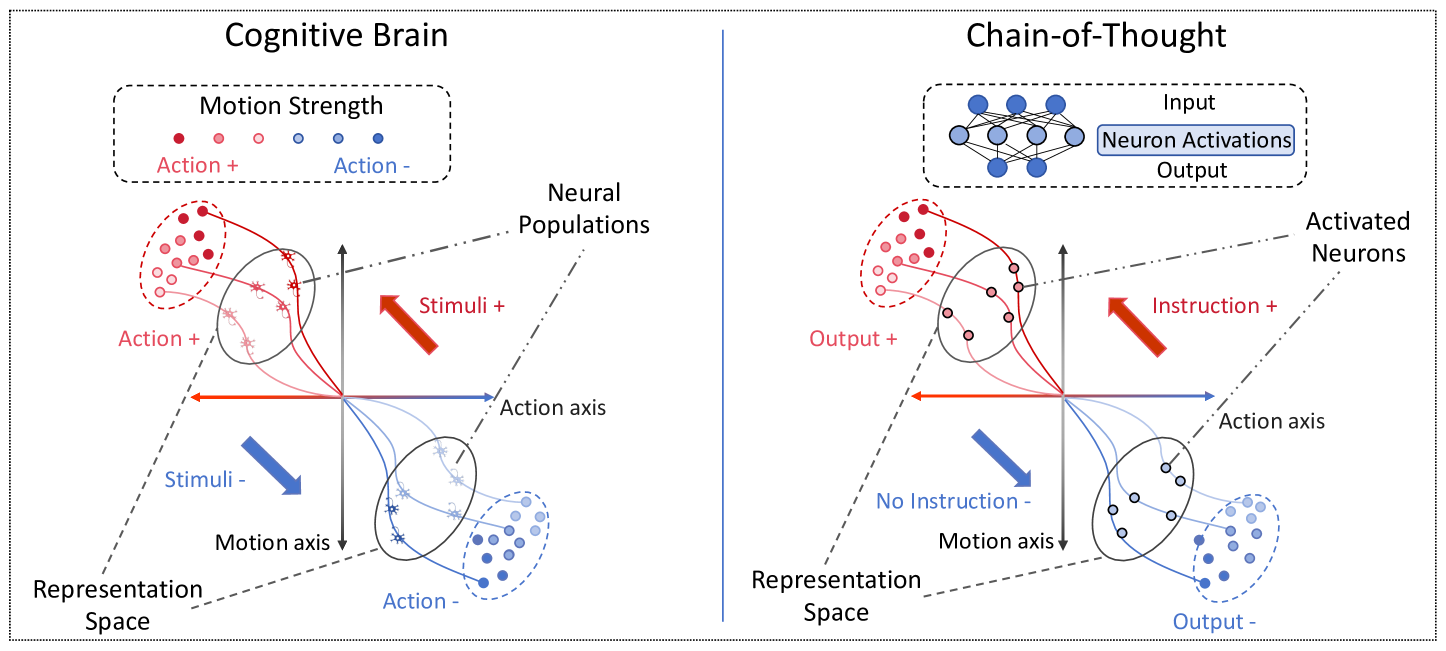
The image presents two interconnected diagrams illustrating neural processing mechanisms. The left diagram ("Cognitive Brain") shows how neural populations are modulated by stimuli and actions, while the right diagram ("Chain-of-Thought") demonstrates how input processing leads to output through activated neurons. Both diagrams use orthogonal axes (Representation Space vs. Action axis) and color-coded neural populations to visualize decision-making dynamics.
### Components/Axes
**Cognitive Brain Diagram:**
- **Axes:**
- Vertical: Representation Space (top to bottom)
- Horizontal: Action axis (left to right)
- **Legend:**
- Motion Strength:
- Red dots = Action +
- Blue dots = Action -
- **Key Elements:**
- Neural Populations (circles with dots)
- Arrows indicating:
- Stimuli + (red arrow)
- Stimuli - (blue arrow)
- Instruction + (red arrow)
- Instruction - (blue arrow)
- Dotted lines marking quadrants
**Chain-of-Thought Diagram:**
- **Axes:**
- Vertical: Representation Space (top to bottom)
- Horizontal: Action axis (left to right)
- **Legend:**
- Neuron Activations: Blue dots
- **Key Elements:**
- Neural Populations (circles with dots)
- Arrows indicating:
- Output + (red arrow)
- Output - (blue arrow)
- Instruction + (red arrow)
- No Instruction - (blue arrow)
- Dotted lines marking quadrants
### Detailed Analysis
**Cognitive Brain Diagram:**
1. **Neural Populations:**
- Top-left: High Motion Strength (red dots) with Stimuli + influence
- Bottom-left: Low Motion Strength (blue dots) with Stimuli - influence
- Top-right: Action + modulation
- Bottom-right: Action - modulation
2. **Directional Influences:**
- Red arrows (Stimuli +/Instruction +) point toward Action +
- Blue arrows (Stimuli -/Instruction -) point toward Action -
**Chain-of-Thought Diagram:**
1. **Input-Output Relationship:**
- Input (blue dots) → Neuron Activations → Output
- Output populations split into:
- Output + (red dots) with Instruction +
- Output - (blue dots) with No Instruction -
2. **Activation Patterns:**
- Activated Neurons cluster in top-right quadrant
- No Instruction - pathway shows lateral inhibition
### Key Observations
1. **Motion Strength Correlation:**
- Red dots (Action +) consistently appear in quadrants with positive directional influences
- Blue dots (Action -) cluster in quadrants with negative influences
2. **Instruction Dependency:**
- Output + requires explicit Instruction + input
- Output - occurs in absence of instruction (default state)
3. **Neural Population Dynamics:**
- Cognitive Brain shows bidirectional modulation (stimuli ↔ actions)
- Chain-of-Thought demonstrates unidirectional processing (input → output)
### Interpretation
The diagrams collectively model a hierarchical neural processing system:
1. **Cognitive Brain** demonstrates how sensory stimuli and motor actions interact through neural populations, with motion strength determining response directionality. The orthogonal axes suggest independent processing streams converging in decision space.
2. **Chain-of-Thought** reveals a feedforward architecture where input processing through activated neurons produces output based on explicit instructions. The absence of instruction creates a baseline output state, implying default cognitive pathways.
3. **Integration Point:** The shared Representation Space and Action axis across both diagrams suggest a unified neural framework where sensory processing (Cognitive Brain) informs decision-making (Chain-of-Thought). The color-coded motion strength and instruction states provide a quantitative measure of neural activation patterns.
4. **Clinical Implications:** The clear demarcation between instructed and non-instructed outputs could inform studies on executive function disorders, while the motion strength modulation might relate to motor control pathologies.