\n
## Line Chart: Optimal Error vs. Alpha for Different d0/d Ratios
### Overview
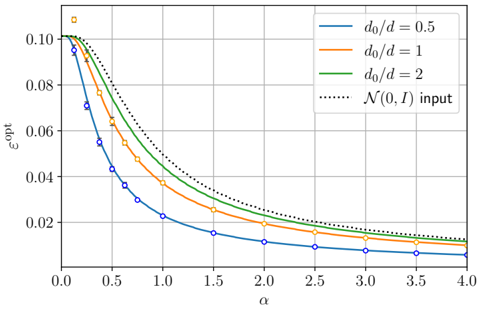
The image presents a line chart illustrating the relationship between the optimal error (εopt) and the alpha (α) parameter for different ratios of d0/d. A fourth curve represents the case of a N(0, 1) input. The chart appears to model the performance of a system or algorithm under varying conditions.
### Components/Axes
* **X-axis:** Labeled "α" (alpha), ranging from 0.0 to 4.0 with increments of 0.5.
* **Y-axis:** Labeled "εopt" (optimal error), ranging from 0.0 to 0.11 with increments of 0.02.
* **Legend:** Located in the top-right corner, listing the following data series:
* `d0/d = 0.5` (Solid Blue Line)
* `d0/d = 1` (Solid Orange Line)
* `d0/d = 2` (Solid Green Line)
* `N(0, 1) input` (Dotted Black Line)
### Detailed Analysis
* **d0/d = 0.5 (Blue Line):** This line exhibits a steep downward slope from α = 0.0 to approximately α = 1.0, then gradually flattens out.
* At α = 0.0, εopt ≈ 0.098.
* At α = 0.5, εopt ≈ 0.065.
* At α = 1.0, εopt ≈ 0.042.
* At α = 2.0, εopt ≈ 0.022.
* At α = 3.0, εopt ≈ 0.014.
* At α = 4.0, εopt ≈ 0.011.
* **d0/d = 1 (Orange Line):** This line also shows a downward trend, but it starts at a lower εopt value than the blue line and flattens out more quickly.
* At α = 0.0, εopt ≈ 0.095.
* At α = 0.5, εopt ≈ 0.058.
* At α = 1.0, εopt ≈ 0.035.
* At α = 2.0, εopt ≈ 0.018.
* At α = 3.0, εopt ≈ 0.012.
* At α = 4.0, εopt ≈ 0.010.
* **d0/d = 2 (Green Line):** This line has the lowest starting εopt value and the most rapid flattening.
* At α = 0.0, εopt ≈ 0.092.
* At α = 0.5, εopt ≈ 0.055.
* At α = 1.0, εopt ≈ 0.033.
* At α = 2.0, εopt ≈ 0.017.
* At α = 3.0, εopt ≈ 0.011.
* At α = 4.0, εopt ≈ 0.009.
* **N(0, 1) input (Black Dotted Line):** This line starts slightly above the orange line and exhibits a similar downward trend, converging with the other lines at higher α values.
* At α = 0.0, εopt ≈ 0.102.
* At α = 0.5, εopt ≈ 0.062.
* At α = 1.0, εopt ≈ 0.038.
* At α = 2.0, εopt ≈ 0.019.
* At α = 3.0, εopt ≈ 0.012.
* At α = 4.0, εopt ≈ 0.010.
### Key Observations
* As α increases, the optimal error (εopt) decreases for all d0/d ratios and the N(0, 1) input.
* Higher d0/d ratios (2 > 1 > 0.5) generally result in lower optimal errors for a given α value.
* The rate of error reduction diminishes as α increases, indicating diminishing returns.
* The N(0, 1) input curve closely follows the d0/d = 1 curve.
* There is a slight outlier at α = 0.0 for the N(0,1) input, being the highest value.
### Interpretation
The chart suggests that the optimal error in the system is inversely related to the alpha parameter. Increasing alpha leads to a reduction in error, but the benefit diminishes as alpha grows larger. The d0/d ratio appears to be a significant factor influencing the optimal error, with higher ratios generally leading to better performance. The N(0, 1) input case behaves similarly to the case where d0/d = 1, suggesting that the input distribution has a comparable effect on the system's performance.
The convergence of all lines at higher α values indicates that the system reaches a point of diminishing returns, where further increases in α have a negligible impact on the optimal error. This could be due to the system reaching its inherent limitations or the influence of other factors not represented in the model. The chart provides valuable insights into the trade-offs between the alpha parameter, the d0/d ratio, and the optimal error, which can be used to optimize the system's performance.