## [Diagram Type]: Retrieval-Augmented Generation (RAG) System Flowchart
### Overview
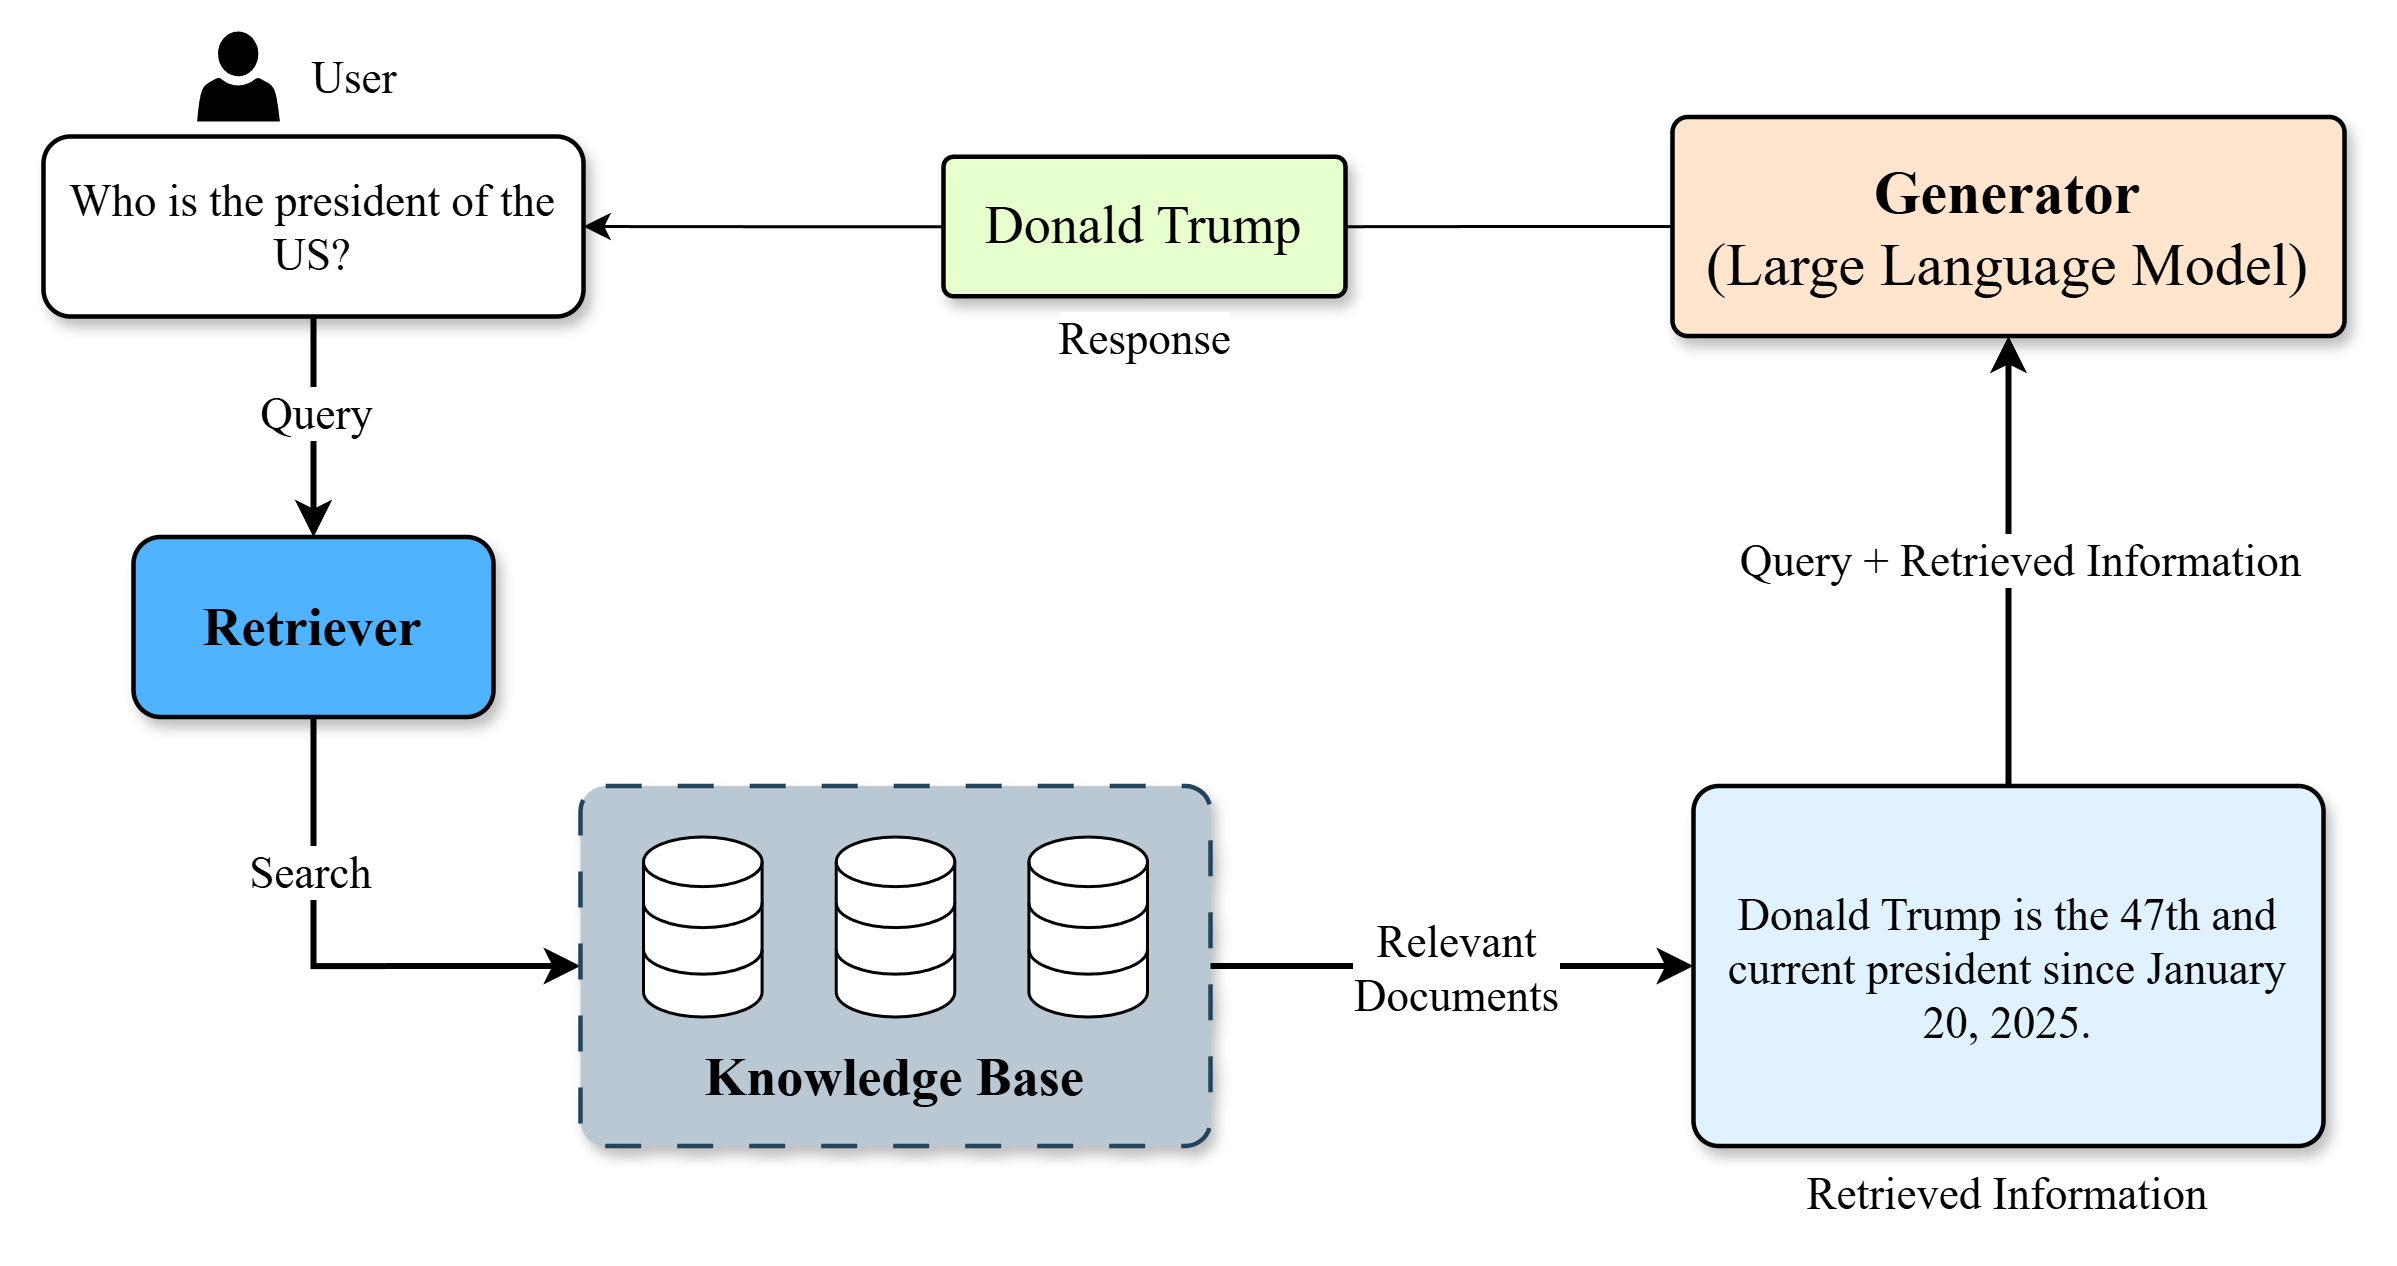
This image is a technical flowchart diagram illustrating the process flow of a Retrieval-Augmented Generation (RAG) system. It demonstrates how a user's natural language query is processed by combining a retrieval component (which searches a knowledge base) with a generative component (a Large Language Model) to produce a final, factually grounded response. The diagram uses labeled boxes, arrows, and icons to represent components and data flow.
### Components/Axes
The diagram is composed of several interconnected components, each with specific labels and functions. The flow is indicated by directional arrows with descriptive labels.
**Components & Labels (in approximate flow order):**
1. **User** (Icon: Person silhouette, top-left)
2. **Query Box** (White rectangle, below User): Contains the text "Who is the president of the US?".
3. **Retriever** (Blue rounded rectangle, left-center): Labeled "Retriever".
4. **Knowledge Base** (Gray dashed-border rectangle, center-bottom): Contains three database cylinder icons and is labeled "Knowledge Base".
5. **Relevant Documents** (Text label on arrow): The output from the Knowledge Base.
6. **Retrieved Information** (Light blue rectangle, bottom-right): Contains the text "Donald Trump is the 47th and current president since January 20, 2025.".
7. **Generator (Large Language Model)** (Orange rounded rectangle, top-right): Labeled "Generator (Large Language Model)".
8. **Response** (Light green rectangle, top-center): Contains the text "Donald Trump".
**Data Flow & Connections (Arrows):**
* **User -> Query Box**: Implicit connection (user provides query).
* **Query Box -> Retriever**: Arrow labeled "Query".
* **Retriever -> Knowledge Base**: Arrow labeled "Search".
* **Knowledge Base -> Retrieved Information**: Arrow labeled "Relevant Documents".
* **Retrieved Information -> Generator**: Arrow labeled "Query + Retrieved Information".
* **Generator -> Response**: Arrow (unlabeled, implies generation).
* **Response -> User**: Arrow (unlabeled, implies delivery to user).
### Detailed Analysis
The diagram explicitly shows a single, linear process for answering a specific factual question.
* **Initial Query:** The process begins with the user's question: "Who is the president of the US?".
* **Retrieval Phase:** The "Retriever" component takes this query and performs a "Search" on the "Knowledge Base".
* **Retrieved Data:** The Knowledge Base returns "Relevant Documents", which are summarized in the "Retrieved Information" box as: "Donald Trump is the 47th and current president since January 20, 2025."
* **Generation Phase:** The "Generator (Large Language Model)" receives both the original "Query" and the "Retrieved Information". It synthesizes this combined input to produce the final "Response": "Donald Trump".
* **Final Output:** The response is delivered back to the user.
### Key Observations
1. **Example-Specific Data:** The diagram uses a concrete example. The retrieved information states a specific fact: Donald Trump is identified as the 47th president with a start date of January 20, 2025.
2. **Component Roles:** The "Retriever" is responsible for finding external facts, while the "Generator" is responsible for formulating a natural language answer based on those facts and the original query.
3. **Flow Logic:** The flow is primarily clockwise, starting at the top-left (User) and ending at the top-center (Response). The "Retrieved Information" box acts as a crucial bridge between the retrieval and generation subsystems.
4. **Visual Coding:** Components are color-coded: Blue for retrieval, Gray for storage, Light Blue for retrieved data, Orange for generation, and Light Green for the final output.
### Interpretation
This diagram serves as an educational or explanatory model for a RAG architecture. It visually argues that a pure LLM (the Generator) might not have the most current or specific factual knowledge (e.g., the exact ordinal number and start date of a presidency) and therefore benefits from being augmented with a dedicated retrieval system.
The **Peircean investigative** reading reveals:
* **Sign (Diagram):** The flowchart itself.
* **Object (Process):** The RAG system's operation.
* **Interpretant (Understanding):** The viewer learns that RAG systems decouple *knowledge storage/retrieval* from *language generation* to produce more accurate and up-to-date responses. The specific example implies the knowledge base contains current events data post-dating the LLM's training cutoff.
The notable "outlier" or specific claim is the factual statement within the "Retrieved Information" box. This is not a generic placeholder but a specific data point used to illustrate the system's function. The diagram's primary purpose is to explain the *mechanism*, not to assert the truth of the example fact, though it uses a plausible future-dated fact to demonstrate the system's utility for current information.