## Line Chart: Effective Dimension vs. Input Size
### Overview
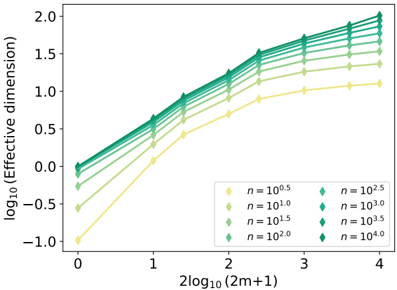
The image is a line chart displaying the relationship between the logarithm base 10 of the effective dimension and the logarithm base 10 of (2m+1) multiplied by 2, for various values of 'n'. The chart contains multiple lines, each representing a different value of 'n', ranging from 10^0.5 to 10^4. The lines generally show an upward trend, indicating that the effective dimension increases as the input size (represented by 2log10(2m+1)) increases.
### Components/Axes
* **X-axis:** 2log10(2m+1), with tick marks at 0, 1, 2, 3, and 4.
* **Y-axis:** log10(Effective dimension), with tick marks at -1.0, -0.5, 0.0, 0.5, 1.0, 1.5, and 2.0.
* **Legend:** Located at the bottom of the chart, it identifies each line by its corresponding 'n' value. The legend entries are:
* Yellow-green: n = 10^0.5
* Light green: n = 10^1.0
* Green: n = 10^1.5
* Dark green: n = 10^2.0
* Teal: n = 10^2.5
* Dark teal: n = 10^3.0
* Blue-green: n = 10^3.5
* Dark blue-green: n = 10^4.0
### Detailed Analysis
**Data Series Trends and Values:**
* **n = 10^0.5 (Yellow-green):** Starts at approximately -1.0 at x=0, rises to approximately 0.0 at x=1, then to approximately 0.5 at x=2, approximately 0.8 at x=3, and approximately 1.0 at x=4. The slope decreases as x increases.
* **n = 10^1.0 (Light green):** Starts at approximately -0.3 at x=0, rises to approximately 0.3 at x=1, then to approximately 0.7 at x=2, approximately 0.9 at x=3, and approximately 1.1 at x=4. The slope decreases as x increases.
* **n = 10^1.5 (Green):** Starts at approximately -0.1 at x=0, rises to approximately 0.4 at x=1, then to approximately 0.8 at x=2, approximately 1.1 at x=3, and approximately 1.3 at x=4. The slope decreases as x increases.
* **n = 10^2.0 (Dark green):** Starts at approximately 0.0 at x=0, rises to approximately 0.5 at x=1, then to approximately 0.9 at x=2, approximately 1.2 at x=3, and approximately 1.4 at x=4. The slope decreases as x increases.
* **n = 10^2.5 (Teal):** Starts at approximately 0.1 at x=0, rises to approximately 0.6 at x=1, then to approximately 1.0 at x=2, approximately 1.3 at x=3, and approximately 1.5 at x=4. The slope decreases as x increases.
* **n = 10^3.0 (Dark teal):** Starts at approximately 0.2 at x=0, rises to approximately 0.7 at x=1, then to approximately 1.1 at x=2, approximately 1.4 at x=3, and approximately 1.6 at x=4. The slope decreases as x increases.
* **n = 10^3.5 (Blue-green):** Starts at approximately 0.3 at x=0, rises to approximately 0.8 at x=1, then to approximately 1.2 at x=2, approximately 1.5 at x=3, and approximately 1.7 at x=4. The slope decreases as x increases.
* **n = 10^4.0 (Dark blue-green):** Starts at approximately 0.4 at x=0, rises to approximately 0.9 at x=1, then to approximately 1.3 at x=2, approximately 1.6 at x=3, and approximately 1.8 at x=4. The slope decreases as x increases.
### Key Observations
* All lines exhibit a positive correlation between 2log10(2m+1) and log10(Effective dimension).
* The rate of increase (slope) decreases as 2log10(2m+1) increases for all values of 'n'.
* As 'n' increases, the log10(Effective dimension) also increases for any given value of 2log10(2m+1).
* The lines appear to converge as 2log10(2m+1) increases, suggesting that the impact of 'n' on the effective dimension diminishes at larger input sizes.
### Interpretation
The chart illustrates how the effective dimension scales with the input size (2m+1) for different values of 'n'. The upward trend of all lines indicates that as the input size increases, the effective dimension also increases. The diminishing slope suggests that the rate of increase in the effective dimension slows down as the input size becomes larger. Furthermore, the separation between the lines indicates that the value of 'n' has a significant impact on the effective dimension, with larger 'n' values leading to higher effective dimensions. The convergence of the lines at higher input sizes suggests that the influence of 'n' becomes less pronounced as the input size grows. This could imply that at very large input sizes, the effective dimension is primarily determined by the input size itself, rather than the specific value of 'n'.