## Line Graph: Effective Dimension vs. 2log₁₀(2m+1)
### Overview
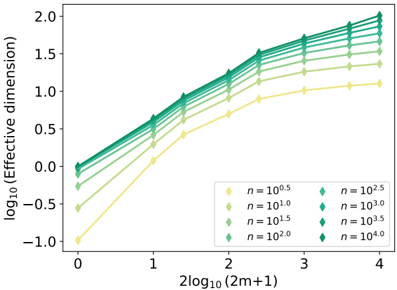
The image is a line graph depicting the relationship between the effective dimension (log₁₀-scaled) and the parameter 2log₁₀(2m+1). Multiple data series are plotted, each corresponding to different values of the variable `n` (ranging from 10⁰.⁵ to 10⁴.⁰). The graph shows upward-trending lines, with steeper slopes for larger `n` values.
### Components/Axes
- **X-axis**: Labeled "2log₁₀(2m+1)", with values ranging from 0 to 4 in increments of 1.
- **Y-axis**: Labeled "log₁₀(Effective dimension)", with values ranging from -1.0 to 2.0 in increments of 0.5.
- **Legend**: Located in the bottom-right corner, mapping colors and markers to `n` values:
- Yellow diamonds: `n = 10⁰.⁵`
- Light green diamonds: `n = 10¹.⁰`
- Medium green diamonds: `n = 10¹.⁵`
- Dark green diamonds: `n = 10².⁰`
- Teal triangles: `n = 10².⁵`
- Light blue triangles: `n = 10³.⁰`
- Medium blue triangles: `n = 10³.⁵`
- Dark blue triangles: `n = 10⁴.⁰`
### Detailed Analysis
- **Trends**:
- All lines exhibit a positive slope, indicating that the effective dimension increases as 2log₁₀(2m+1) increases.
- Lines for larger `n` values (e.g., `n = 10³.⁵`, `n = 10⁴.⁰`) are steeper, suggesting a stronger dependency on the parameter for larger datasets.
- At `2log₁₀(2m+1) = 0`, the effective dimension starts near -1.0 for `n = 10⁰.⁵` and ~0.0 for `n = 10⁴.⁰`.
- At `2log₁₀(2m+1) = 4`, the effective dimension reaches ~1.5 for `n = 10⁰.⁵` and ~2.0 for `n = 10⁴.⁰`.
- **Data Points**:
- **`n = 10⁰.⁵` (yellow diamonds)**: Starts at ~-1.0 (x=0), ends at ~1.1 (x=4).
- **`n = 10¹.⁰` (light green diamonds)**: Starts at ~-0.5 (x=0), ends at ~1.3 (x=4).
- **`n = 10¹.⁵` (medium green diamonds)**: Starts at ~0.0 (x=0), ends at ~1.4 (x=4).
- **`n = 10².⁰` (dark green diamonds)**: Starts at ~0.2 (x=0), ends at ~1.5 (x=4).
- **`n = 10².⁵` (teal triangles)**: Starts at ~0.3 (x=0), ends at ~1.6 (x=4).
- **`n = 10³.⁰` (light blue triangles)**: Starts at ~0.4 (x=0), ends at ~1.7 (x=4).
- **`n = 10³.⁵` (medium blue triangles)**: Starts at ~0.5 (x=0), ends at ~1.8 (x=4).
- **`n = 10⁴.⁰` (dark blue triangles)**: Starts at ~0.6 (x=0), ends at ~2.0 (x=4).
### Key Observations
1. **Positive Correlation**: The effective dimension consistently increases with 2log₁₀(2m+1) across all `n` values.
2. **Scaling with `n`**: Larger `n` values result in higher effective dimensions at the same 2log₁₀(2m+1) value.
3. **Slope Magnitude**: The slope steepness increases with `n`, indicating a nonlinear relationship where larger datasets amplify the effect of the parameter.
### Interpretation
The graph demonstrates that the effective dimension grows with both the parameter 2log₁₀(2m+1) and the dataset size `n`. The steeper slopes for larger `n` suggest that computational or theoretical models relying on this dimension may face increased complexity or resource demands as dataset size grows. This could have implications for fields like machine learning, where dimensionality impacts algorithm efficiency, or physics, where effective dimensions influence system behavior. The uniformity of trends across `n` values implies a generalizable relationship, though the exact mechanism (e.g., linear vs. logarithmic scaling) would require further mathematical analysis.