## Chart: Loss vs. Number of Parameters
### Overview
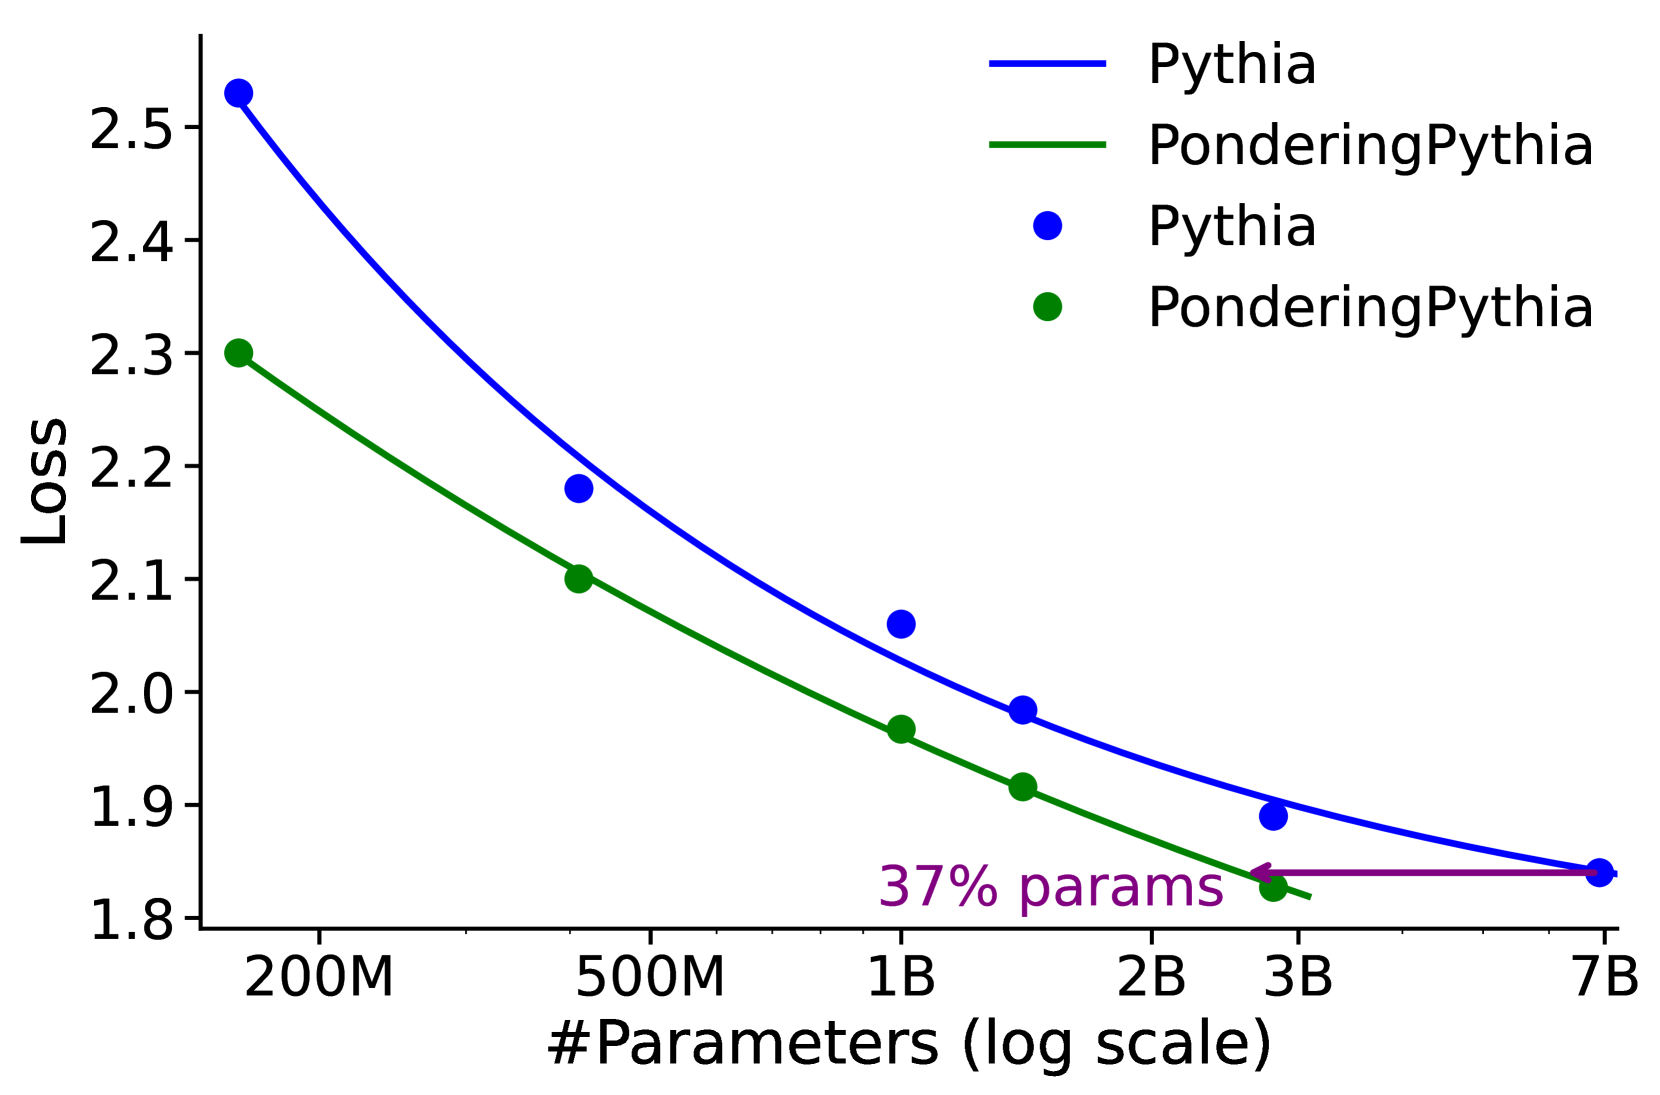
The image is a line chart comparing the loss of two models, "Pythia" and "PonderingPythia," as a function of the number of parameters. The x-axis represents the number of parameters on a logarithmic scale, and the y-axis represents the loss. The chart includes data points for each model and smoothed lines connecting these points.
### Components/Axes
* **Title:** There is no explicit title on the chart.
* **X-axis:**
* Label: "#Parameters (log scale)"
* Scale: 200M, 500M, 1B, 2B, 3B, 7B (logarithmic scale)
* **Y-axis:**
* Label: "Loss"
* Scale: 1.8 to 2.5, with increments of 0.1
* **Legend:** Located in the top-right corner.
* Blue line: Pythia
* Green line: PonderingPythia
* Blue dots: Pythia
* Green dots: PonderingPythia
* **Annotation:** "37% params" with a purple arrow pointing from 3B to the Pythia line at approximately loss 1.85.
### Detailed Analysis
* **Pythia (Blue):**
* Trend: The loss decreases as the number of parameters increases.
* Data Points:
* 200M: Approximately 2.55
* 500M: Approximately 2.18
* 1B: Approximately 2.06
* 2B: Approximately 1.98
* 7B: Approximately 1.84
* **PonderingPythia (Green):**
* Trend: The loss decreases as the number of parameters increases.
* Data Points:
* 200M: Approximately 2.30
* 500M: Approximately 2.10
* 1B: Approximately 1.97
* 2B: Approximately 1.91
* 3B: Approximately 1.88
* **Annotation:**
* The purple arrow indicates that using 37% of the parameters of the Pythia model at 7B parameters, the PonderingPythia model achieves a similar loss.
### Key Observations
* Both models exhibit a decrease in loss as the number of parameters increases.
* PonderingPythia consistently shows a lower loss than Pythia for the same number of parameters.
* The rate of decrease in loss diminishes as the number of parameters increases for both models.
* The annotation highlights that PonderingPythia can achieve a similar loss to Pythia with significantly fewer parameters.
### Interpretation
The chart demonstrates the relationship between model size (number of parameters) and performance (loss) for two different models, Pythia and PonderingPythia. The data suggests that PonderingPythia is more efficient, achieving lower loss values with fewer parameters compared to Pythia. The annotation "37% params" emphasizes this efficiency, indicating that PonderingPythia can match Pythia's performance with a significantly smaller model size. This could imply that PonderingPythia has a more efficient architecture or training process. The diminishing returns in loss reduction as parameters increase suggest that there is a point of diminishing returns in simply scaling up model size.