\n
## Line Chart: Loss vs. Number of Parameters for Pythia and PonderingPythia
### Overview
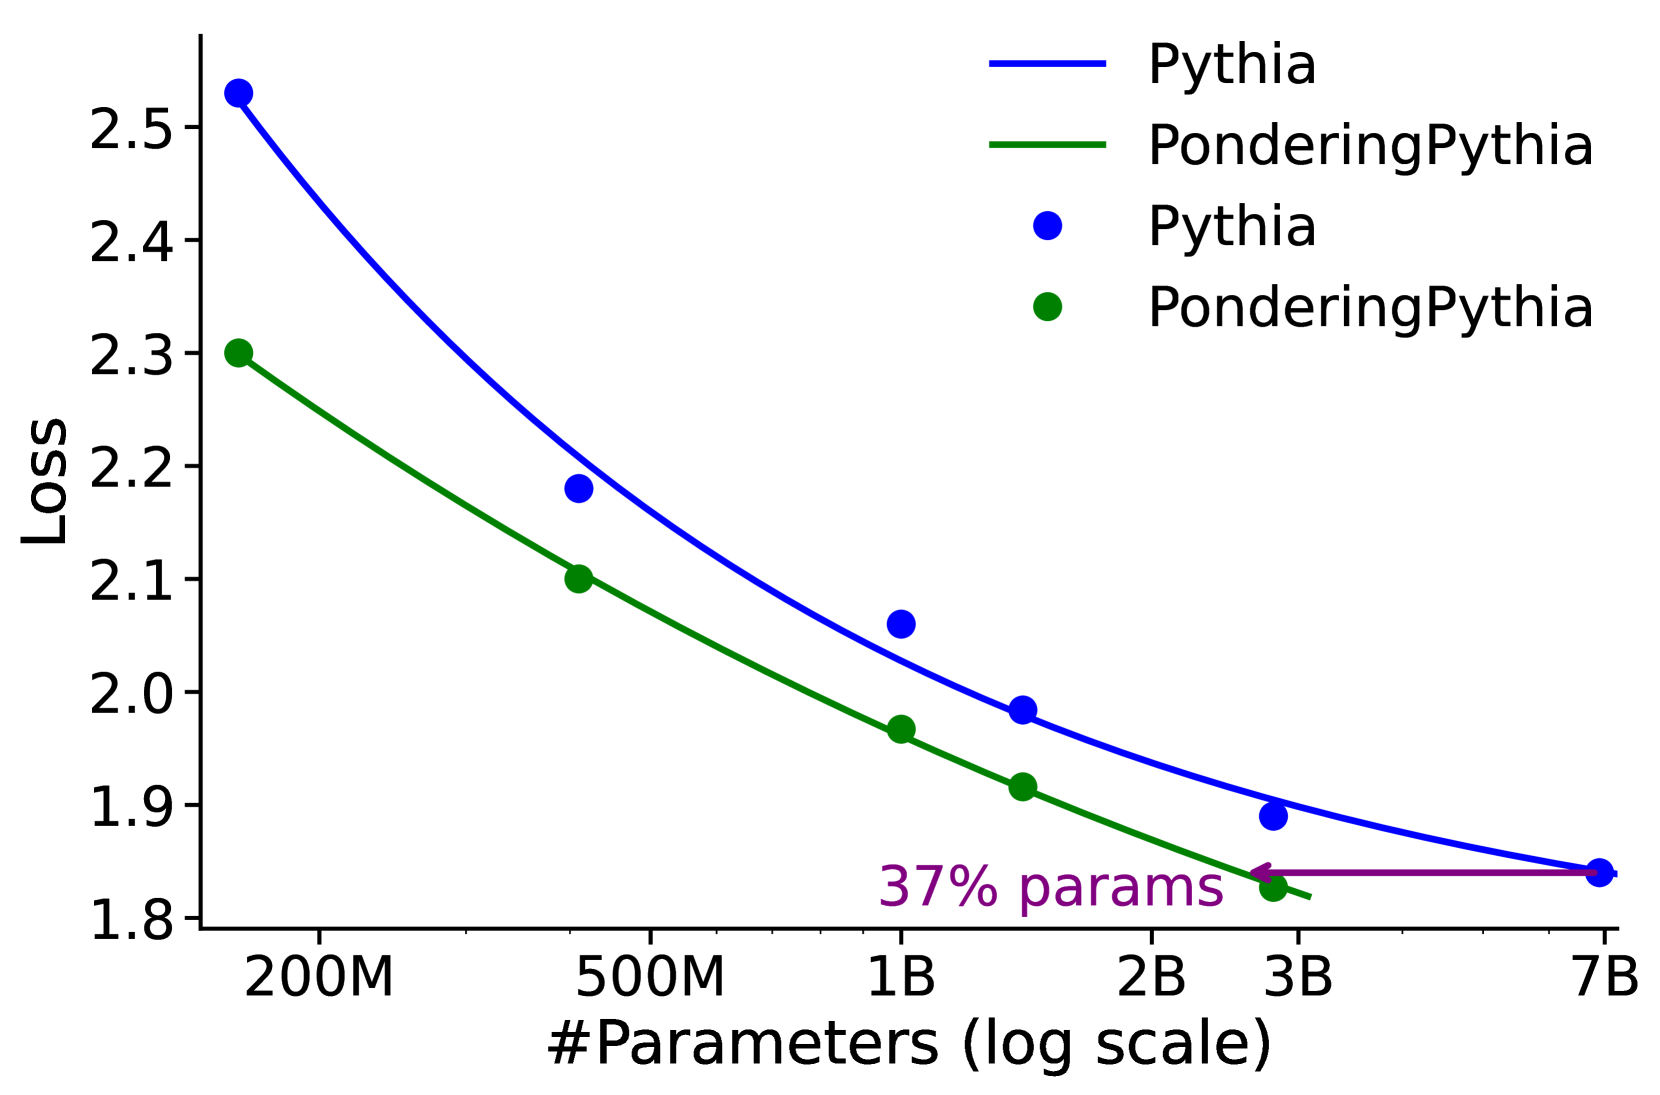
This chart displays the relationship between the number of parameters in two language models, Pythia and PonderingPythia, and their corresponding loss values. The x-axis represents the number of parameters on a logarithmic scale, while the y-axis represents the loss. The chart uses lines and data points to illustrate how loss decreases as the number of parameters increases for both models.
### Components/Axes
* **X-axis Title:** "#Parameters (log scale)"
* **X-axis Markers:** 200M, 500M, 1B, 2B, 3B, 7B (representing millions and billions of parameters)
* **Y-axis Title:** "Loss"
* **Y-axis Scale:** Ranges from approximately 1.8 to 2.6.
* **Legend:** Located at the top-right of the chart.
* **Pythia:** Represented by a dark blue line and blue data points.
* **PonderingPythia:** Represented by a dark green line and green data points.
* **Annotation:** "37% params" is placed near the 1B parameter mark, likely indicating the parameter size of PonderingPythia relative to Pythia.
### Detailed Analysis
**Pythia (Dark Blue Line & Points):**
The Pythia line slopes downward, indicating that loss decreases as the number of parameters increases.
* At 200M parameters: Loss is approximately 2.55.
* At 500M parameters: Loss is approximately 2.20.
* At 1B parameters: Loss is approximately 2.00.
* At 2B parameters: Loss is approximately 1.92.
* At 3B parameters: Loss is approximately 1.89.
* At 7B parameters: Loss is approximately 1.86.
**PonderingPythia (Dark Green Line & Points):**
The PonderingPythia line also slopes downward, but the decrease in loss is less pronounced than for Pythia.
* At 200M parameters: Loss is approximately 2.30.
* At 500M parameters: Loss is approximately 2.10.
* At 1B parameters: Loss is approximately 1.95.
* At 2B parameters: Loss is approximately 1.89.
* At 3B parameters: Loss is approximately 1.87.
* At 7B parameters: Loss is approximately 1.86.
### Key Observations
* Both models exhibit a decreasing loss as the number of parameters increases, suggesting that larger models generally perform better (lower loss).
* Pythia consistently has a higher loss than PonderingPythia across all parameter sizes.
* The difference in loss between the two models appears to diminish as the number of parameters increases, converging around 7B parameters.
* The annotation "37% params" suggests that PonderingPythia uses approximately 37% of the parameters compared to Pythia at the 1B parameter level.
### Interpretation
The chart demonstrates the scaling behavior of two language models. Increasing the number of parameters generally leads to improved performance (lower loss). However, PonderingPythia achieves comparable or better performance than Pythia with significantly fewer parameters. This suggests that PonderingPythia is a more parameter-efficient model, potentially due to architectural differences or training strategies. The convergence of the loss curves at higher parameter counts indicates that the benefits of increasing parameters may diminish beyond a certain point. The "37% params" annotation is crucial; it highlights the efficiency of PonderingPythia, implying it achieves similar results to Pythia with a much smaller model size. This has implications for computational cost, memory requirements, and deployment feasibility. The logarithmic scale on the x-axis is important because it visually represents the exponential increase in parameters, making it easier to compare the models' performance across a wide range of sizes.