## Line Graph: Loss vs. Number of Parameters for Pythia and PonderingPythia
### Overview
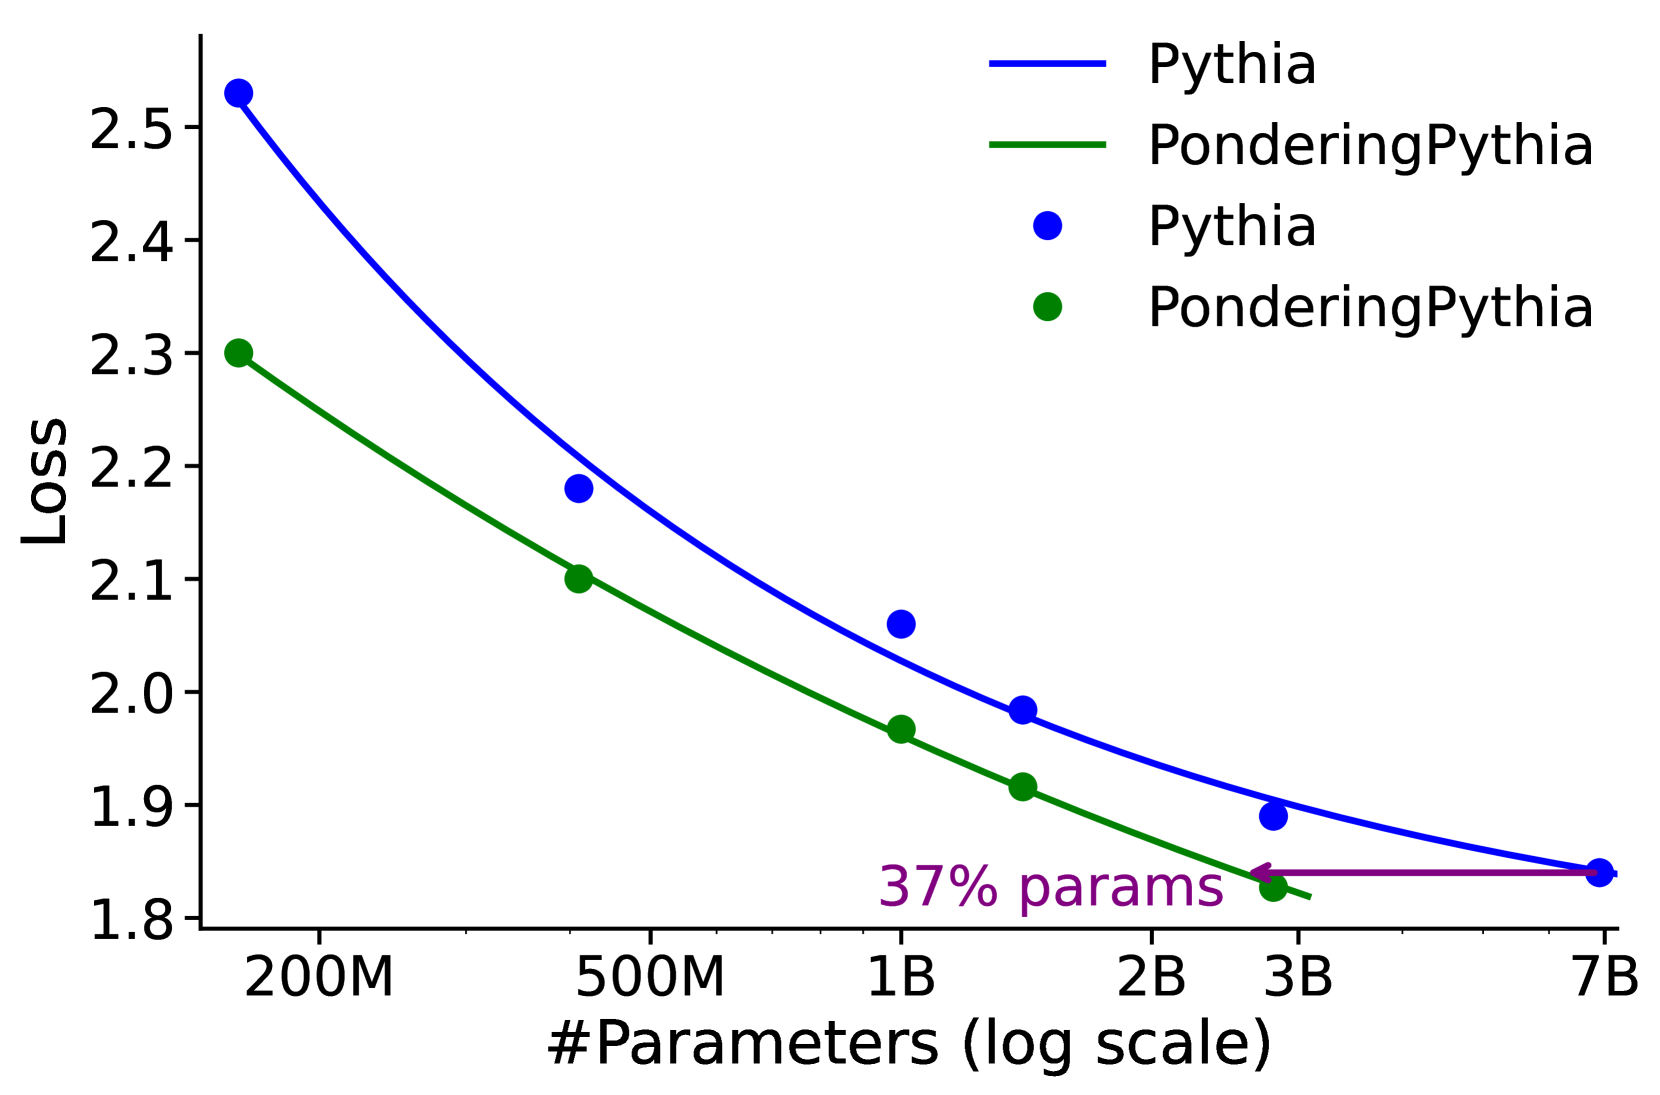
The image is a line graph comparing the "Loss" metric across different numbers of parameters (log scale) for two models: **Pythia** (blue line) and **PonderingPythia** (green line). The graph includes data points for each model and a purple arrow highlighting a specific point on the PonderingPythia line. The y-axis represents "Loss" (ranging from 1.8 to 2.5), and the x-axis represents the number of parameters (log scale, from 200M to 7B).
---
### Components/Axes
- **X-axis**: "#Parameters (log scale)" with labeled ticks at 200M, 500M, 1B, 2B, 3B, and 7B.
- **Y-axis**: "Loss" with values from 1.8 to 2.5.
- **Legend**: Located in the **top-right** corner, with:
- **Blue line**: Labeled "Pythia"
- **Green line**: Labeled "PonderingPythia"
- **Data Points**:
- **Blue circles**: Represent Pythia's loss values.
- **Green squares**: Represent PonderingPythia's loss values.
- **Purple Arrow**: Located in the **bottom-right** corner, pointing to a data point on the PonderingPythia line. The arrow is labeled "37% params".
---
### Detailed Analysis
#### Pythia (Blue Line)
- **Trend**: The loss decreases as the number of parameters increases, following a steep downward slope.
- **Data Points**:
- 200M parameters: ~2.55
- 500M parameters: ~2.18
- 1B parameters: ~2.05
- 2B parameters: ~1.95
- 3B parameters: ~1.88
- 7B parameters: ~1.85
#### PonderingPythia (Green Line)
- **Trend**: The loss decreases more gradually compared to Pythia, with a flatter slope.
- **Data Points**:
- 200M parameters: ~2.30
- 500M parameters: ~2.10
- 1B parameters: ~1.95
- 2B parameters: ~1.90
- 3B parameters: ~1.85
- 7B parameters: ~1.80
#### Purple Arrow
- **Position**: Points to the **200M parameters** data point on the PonderingPythia line.
- **Label**: "37% params" (exact meaning unclear; likely refers to a parameter efficiency metric or a specific threshold, but not explicitly defined in the graph).
---
### Key Observations
1. **Loss Reduction**: Both models show a clear trend of decreasing loss as parameters increase, but Pythia achieves lower loss at higher parameter counts.
2. **Efficiency**: PonderingPythia maintains lower loss at smaller parameter sizes (e.g., 200M parameters: 2.30 vs. Pythia's 2.55).
3. **37% Annotation**: The purple arrow highlights a specific point on PonderingPythia's line, but the exact parameter value (200M) does not align with a 37% calculation of 7B (which would be ~2.59B). This suggests the "37% params" may refer to a different metric (e.g., parameter efficiency relative to Pythia or a custom threshold).
---
### Interpretation
- **Model Performance**: Pythia demonstrates superior performance at larger parameter scales, while PonderingPythia offers better efficiency at smaller scales.
- **37% Annotation**: The label "37% params" likely indicates a specific parameter efficiency or threshold for PonderingPythia, but the graph does not clarify its exact meaning. This could imply that PonderingPythia achieves comparable loss with fewer parameters (e.g., 37% of Pythia's parameters for similar performance).
- **Log Scale Implications**: The x-axis's log scale emphasizes the exponential growth of parameters, highlighting the trade-off between parameter count and loss reduction.
---
### Notes on Data Extraction
- All labels, axis titles, and legend entries were extracted as described.
- Data points were approximated based on their positions relative to the axes.
- The purple arrow's label ("37% params") was transcribed verbatim, but its exact interpretation requires additional context not provided in the image.