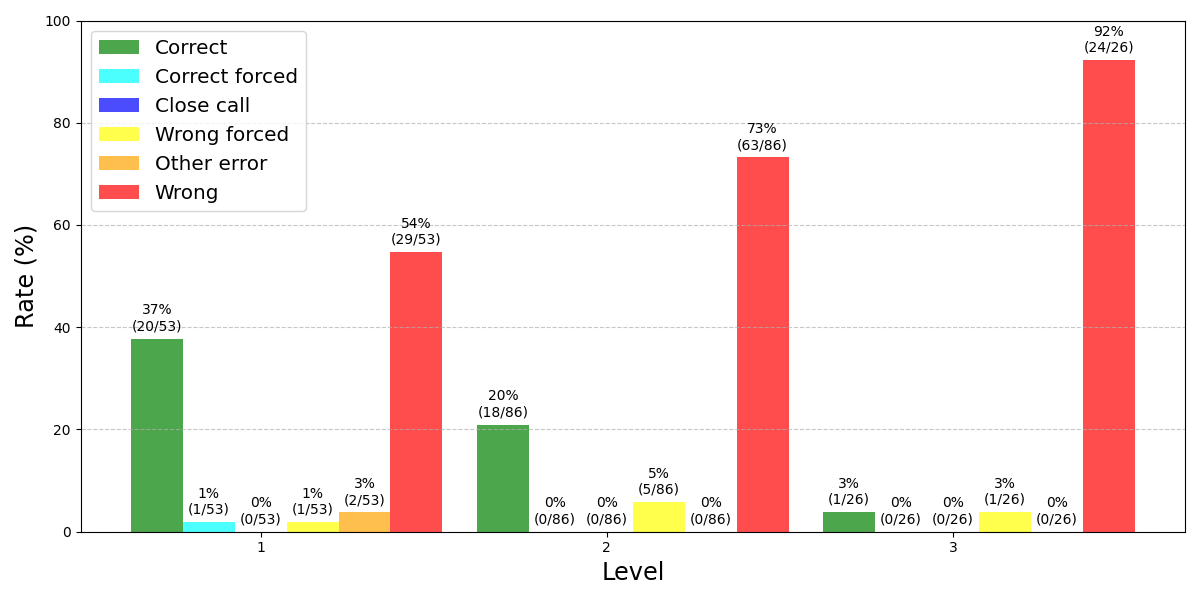
## Bar Chart: Performance Rates by Level
### Overview
The image is a bar chart comparing the rates of different outcomes (Correct, Correct forced, Close call, Wrong forced, Other error, and Wrong) across three levels (1, 2, and 3). The y-axis represents the rate in percentage, ranging from 0% to 100%. Each level has a set of bars representing the rates of each outcome. The chart includes a legend in the top-left corner to identify the color associated with each outcome.
### Components/Axes
* **X-axis:** "Level" with categories 1, 2, and 3.
* **Y-axis:** "Rate (%)" ranging from 0 to 100, with gridlines at intervals of 20.
* **Legend:** Located in the top-left corner, mapping colors to outcomes:
* Green: Correct
* Cyan: Correct forced
* Blue: Close call
* Yellow: Wrong forced
* Orange: Other error
* Red: Wrong
### Detailed Analysis
**Level 1:**
* **Correct (Green):** 37% (20/53)
* **Correct forced (Cyan):** 1% (1/53)
* **Close call (Blue):** 0% (0/53)
* **Wrong forced (Yellow):** 1% (1/53)
* **Other error (Orange):** 3% (2/53)
* **Wrong (Red):** 54% (29/53)
**Level 2:**
* **Correct (Green):** 20% (18/86)
* **Correct forced (Cyan):** 0% (0/86)
* **Close call (Blue):** 0% (0/86)
* **Wrong forced (Yellow):** 5% (5/86)
* **Other error (Orange):** 0% (0/86)
* **Wrong (Red):** 73% (63/86)
**Level 3:**
* **Correct (Green):** 3% (1/26)
* **Correct forced (Cyan):** 0% (0/26)
* **Close call (Blue):** 0% (0/26)
* **Wrong forced (Yellow):** 3% (1/26)
* **Other error (Orange):** 0% (0/26)
* **Wrong (Red):** 92% (24/26)
### Key Observations
* The "Wrong" outcome (red) increases significantly from Level 1 (54%) to Level 2 (73%) to Level 3 (92%).
* The "Correct" outcome (green) decreases from Level 1 (37%) to Level 2 (20%) to Level 3 (3%).
* "Correct forced," "Close call," and "Other error" outcomes are consistently low across all levels.
* "Wrong forced" is low, but slightly higher in Level 2 (5%) compared to Levels 1 and 3 (1% and 3% respectively).
### Interpretation
The data suggests that as the level increases, the rate of "Wrong" outcomes increases dramatically, while the rate of "Correct" outcomes decreases. This indicates a potential increase in difficulty or complexity as the level progresses, leading to more errors. The consistently low rates of "Correct forced," "Close call," and "Other error" suggest these outcomes are relatively rare across all levels. The increase in "Wrong forced" at level 2 could indicate a specific challenge or change in the task at that level. Overall, the chart highlights a clear trend of decreasing performance with increasing level.