\n
## Stacked Bar Chart: Error Rate by Level
### Overview
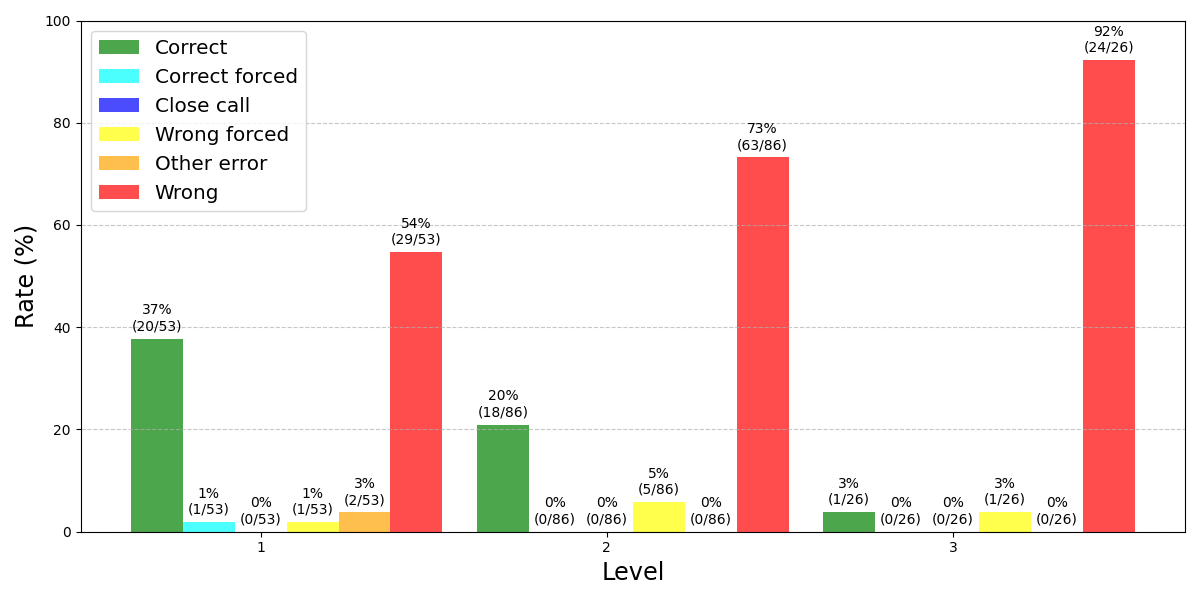
This is a stacked bar chart visualizing the rate of different error types across three levels. The chart displays the percentage of each error type for each level, with the total height of each bar representing 100%. The error types are categorized as "Correct", "Correct forced", "Close call", "Wrong forced", "Other error", and "Wrong".
### Components/Axes
* **X-axis:** "Level" with markers 1, 2, and 3.
* **Y-axis:** "Rate (%)" ranging from 0 to 100.
* **Legend:** Located in the top-left corner, defining the color-coding for each error type:
* Green: Correct
* Light Green: Correct forced
* Blue: Close call
* Orange: Wrong forced
* Yellow: Other error
* Red: Wrong
* Each bar is segmented to represent the proportion of each error type within that level. The number of errors/total attempts is displayed within each segment.
### Detailed Analysis
**Level 1:**
* **Correct (Green):** 37% (20/53). The green segment occupies the lower portion of the bar.
* **Correct forced (Light Green):** 1% (1/53). A very small light green segment at the base.
* **Close call (Blue):** 0% (0/53). No blue segment.
* **Wrong forced (Orange):** 3% (2/53). A small orange segment.
* **Other error (Yellow):** 0% (0/53). No yellow segment.
* **Wrong (Red):** 54% (29/53). The largest segment, occupying the upper portion of the bar.
**Level 2:**
* **Correct (Green):** 20% (18/86).
* **Correct forced (Light Green):** 0% (0/86).
* **Close call (Blue):** 0% (0/86).
* **Wrong forced (Orange):** 5% (5/86).
* **Other error (Yellow):** 0% (0/86).
* **Wrong (Red):** 73% (63/86).
**Level 3:**
* **Correct (Green):** 3% (1/26).
* **Correct forced (Light Green):** 0% (0/26).
* **Close call (Blue):** 3% (1/26).
* **Wrong forced (Orange):** 0% (0/26).
* **Other error (Yellow):** 0% (0/26).
* **Wrong (Red):** 92% (24/26).
### Key Observations
* The proportion of "Wrong" errors increases significantly as the level increases.
* Level 1 has the highest proportion of "Wrong" errors (54%) and the lowest proportion of "Correct" errors (37%).
* Level 3 has the highest proportion of "Wrong" errors (92%) and the lowest proportion of "Correct" errors (3%).
* "Correct forced", "Close call", "Wrong forced", and "Other error" contribute minimally to the overall error rates, especially at levels 2 and 3.
### Interpretation
The data suggests a clear trend: as the level of difficulty increases, the rate of "Wrong" errors dramatically increases, while the rate of "Correct" errors decreases. This indicates that the task becomes significantly more challenging at higher levels. The consistent dominance of the "Wrong" error category at levels 2 and 3 suggests a fundamental difficulty in performing the task correctly at those levels. The low occurrence of "Correct forced", "Close call", "Wrong forced", and "Other error" suggests these categories are less relevant to the overall performance trend. The data could be used to identify areas for improvement in training or task design to reduce the error rate at higher levels. The inclusion of the number of errors/total attempts (e.g., 20/53) provides a sense of the sample size and the reliability of the percentages.