## Bar Chart: Rate (%) by Level
### Overview
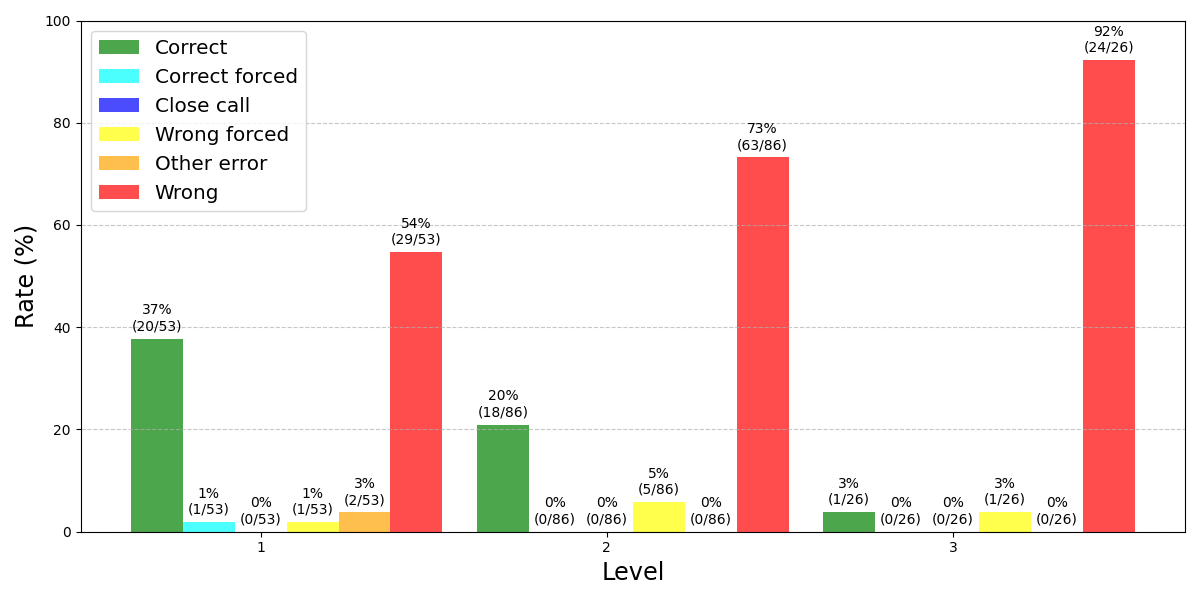
The chart displays the distribution of response rates (in percentages) across three levels (1, 2, 3) for six categories: Correct, Correct forced, Close call, Wrong forced, Other error, and Wrong. The y-axis represents the rate (%), and the x-axis represents the levels. Each bar is color-coded according to the legend on the left.
### Components/Axes
- **Y-axis**: Rate (%) from 0% to 100% in increments of 20%.
- **X-axis**: Levels labeled as "1", "2", and "3".
- **Legend**:
- Green: Correct
- Light blue: Correct forced
- Dark blue: Close call
- Yellow: Wrong forced
- Orange: Other error
- Red: Wrong
### Detailed Analysis
#### Level 1
- **Correct**: 37% (green bar, 20/53 total)
- **Correct forced**: 1% (light blue bar, 1/53 total)
- **Close call**: 0% (dark blue bar, 0/53 total)
- **Wrong forced**: 1% (yellow bar, 1/53 total)
- **Other error**: 3% (orange bar, 2/53 total)
- **Wrong**: 54% (red bar, 29/53 total)
#### Level 2
- **Correct**: 20% (green bar, 18/86 total)
- **Correct forced**: 0% (light blue bar, 0/86 total)
- **Close call**: 0% (dark blue bar, 0/86 total)
- **Wrong forced**: 5% (yellow bar, 5/86 total)
- **Other error**: 0% (orange bar, 0/86 total)
- **Wrong**: 73% (red bar, 63/86 total)
#### Level 3
- **Correct**: 3% (green bar, 3/26 total)
- **Correct forced**: 0% (light blue bar, 0/26 total)
- **Close call**: 0% (dark blue bar, 0/26 total)
- **Wrong forced**: 3% (yellow bar, 1/26 total)
- **Other error**: 0% (orange bar, 0/26 total)
- **Wrong**: 92% (red bar, 24/26 total)
### Key Observations
1. **Wrong responses dominate**: The "Wrong" category (red bars) increases sharply from 54% (Level 1) to 73% (Level 2) to 92% (Level 3), indicating a significant rise in incorrect answers as the level increases.
2. **Correct responses decline**: The "Correct" category (green bars) decreases from 37% (Level 1) to 20% (Level 2) to 3% (Level 3), suggesting lower accuracy at higher levels.
3. **Minimal "Correct forced" and "Close call"**: These categories (light blue and dark blue bars) are consistently near 0% across all levels, except for minor 1% in Level 1.
4. **Other error only in Level 1**: The "Other error" category (orange bar) appears only in Level 1 at 3%, with no occurrences in Levels 2 and 3.
5. **Wrong forced increases slightly**: The "Wrong forced" category (yellow bar) rises from 1% (Level 1) to 5% (Level 2) to 3% (Level 3), showing a minor fluctuation.
### Interpretation
The data suggests that as the difficulty level increases (from Level 1 to Level 3), the proportion of incorrect answers ("Wrong") grows substantially, while the proportion of correct answers ("Correct") declines sharply. This implies that higher levels are more challenging, leading to a higher error rate. The near-absence of "Correct forced" and "Close call" categories indicates that these response types are rare or not applicable in this context. The presence of "Other error" only in Level 1 may reflect ambiguous or edge-case questions at lower levels. The "Wrong forced" category shows a slight increase at Level 2 but stabilizes at Level 3, suggesting a possible threshold effect where forced errors become less frequent at the highest level. Overall, the chart highlights a clear inverse relationship between difficulty level and accuracy.