\n
## Diagram: Soft Thinking Process
### Overview
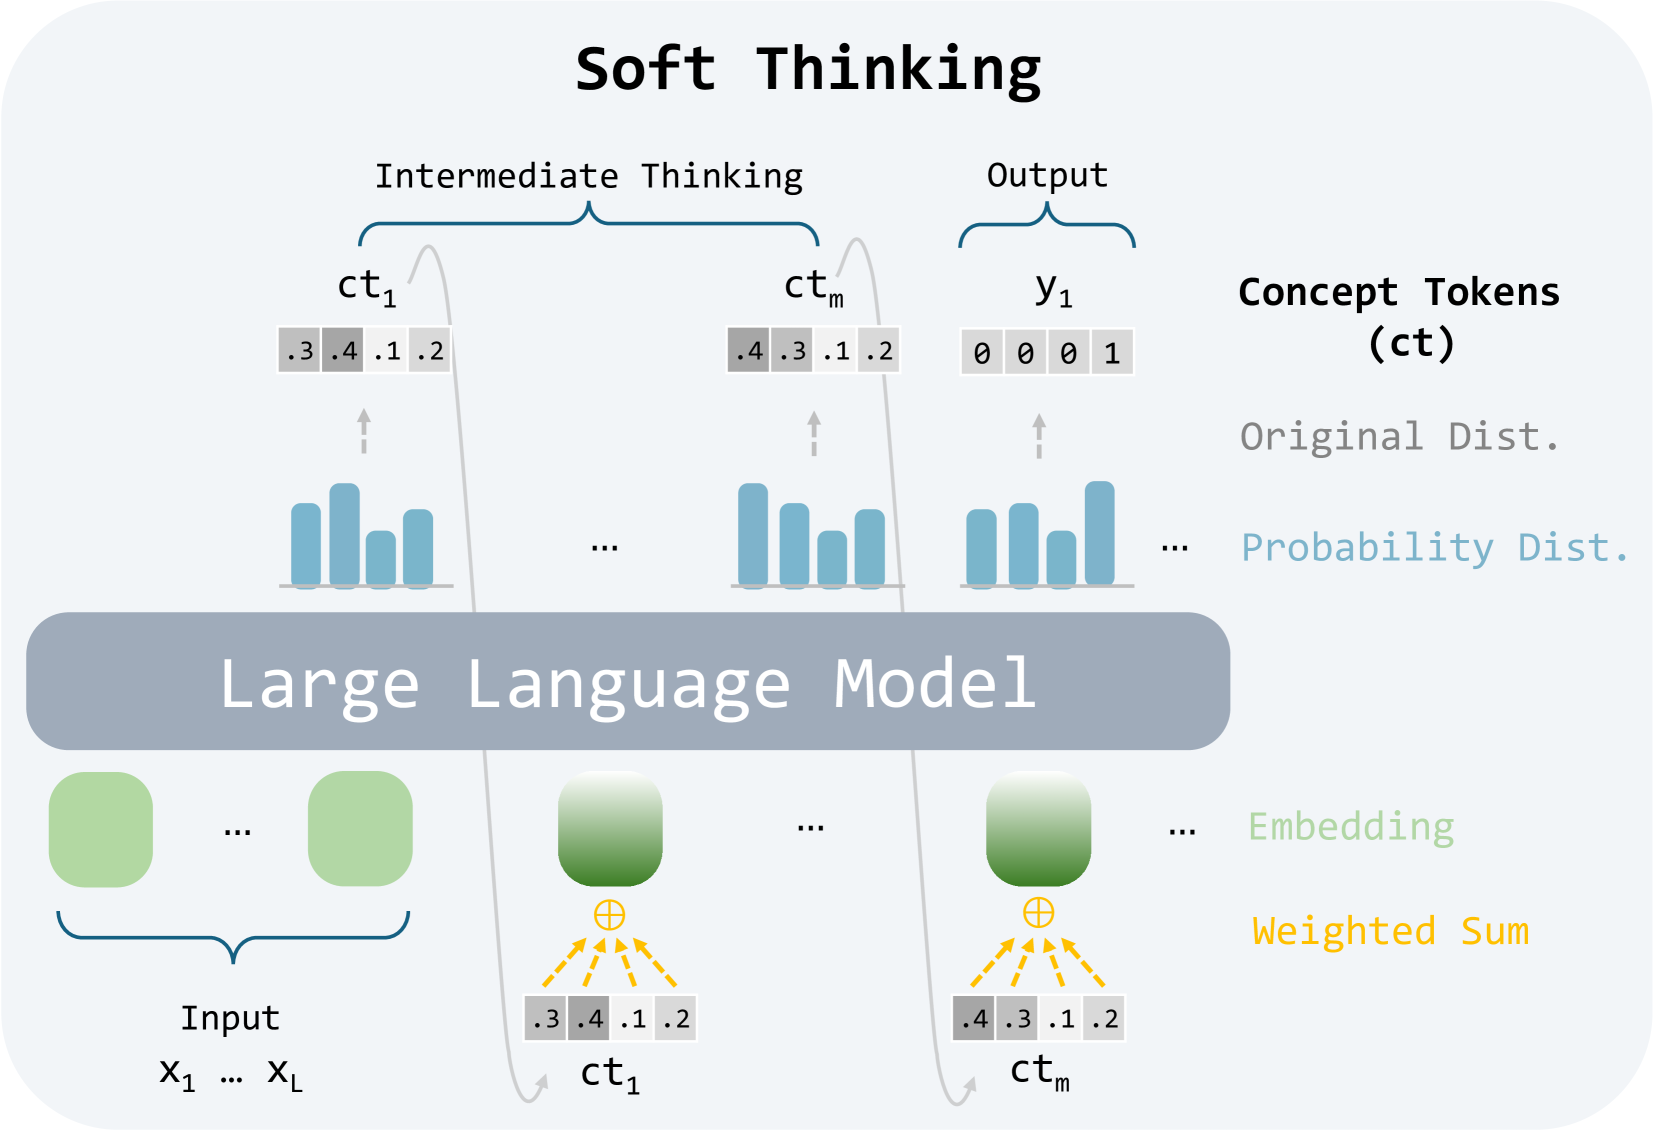
This diagram illustrates the "Soft Thinking" process within a Large Language Model (LLM). It depicts how input data (X1…XL) is processed through the LLM to generate concept tokens (ct1…ctm) and ultimately an output (y1). The diagram highlights the intermediate thinking steps and the transformation of data into probability distributions.
### Components/Axes
The diagram is segmented into three main regions: Input, Large Language Model, and Output/Concept Tokens.
* **Input:** Labeled "Input" and shows a series of variables X1…XL.
* **Large Language Model:** A large, light-purple rectangular area labeled "Large Language Model". Contains green circular nodes representing embeddings.
* **Intermediate Thinking/Output:** A row of rectangular blocks labeled "Intermediate Thinking" and "Output". These blocks contain bar graphs and the final output variable y1.
* **Concept Tokens (ct):** A vertical label on the right side of the diagram, defining the concept tokens as "ct".
* **Original Dist./Probability Dist.:** A vertical label on the right side of the diagram, describing the bar graphs as representing "Original Dist." and "Probability Dist.".
* **Embedding/Weighted Sum:** A vertical label on the right side of the diagram, describing the connections between the green nodes and the concept tokens.
### Detailed Analysis or Content Details
The diagram shows the following process:
1. **Input:** The input consists of a series of variables denoted as X1…XL.
2. **Embedding:** Each input variable is processed by the LLM, represented by green circular nodes. These nodes represent embeddings.
3. **Weighted Sum:** The embeddings are combined using a weighted sum, indicated by orange arrows converging on a point below each node. The resulting values are represented as concept tokens (ct1, ctm).
4. **Concept Tokens:** Each concept token (ct1, ctm) is associated with a set of numerical values: .3, .4, .1, .2. These values appear to represent probabilities or weights.
5. **Intermediate Thinking:** Each concept token (ct1…ctm) is then visualized as a bar graph. The height of each bar within the graph corresponds to the numerical values associated with the concept token. The bar graphs show a distribution of values.
6. **Output:** The final output (y1) is represented by a single block with three bars, with values 0, 0, and 1.
The concept tokens ct1 and ctm both have the same numerical values: .3, .4, .1, .2. The bar graphs associated with these tokens appear to have similar distributions.
### Key Observations
* The diagram emphasizes the transformation of input data into concept tokens and then into a final output.
* The use of bar graphs suggests that the LLM is working with probability distributions.
* The weighted sum operation indicates that different input variables may have different levels of influence on the concept tokens.
* The concept tokens ct1 and ctm share the same numerical values, suggesting they represent similar concepts or features.
* The final output y1 has a clear distinction between the first two bars (0) and the last bar (1), potentially indicating a binary classification or decision.
### Interpretation
This diagram illustrates a simplified model of how a Large Language Model might perform "soft thinking." The process involves converting input data into embeddings, combining these embeddings to form concept tokens, and then using these tokens to generate an output. The use of probability distributions suggests that the LLM is not making deterministic decisions but rather considering a range of possibilities. The shared numerical values for ct1 and ctm suggest that the model is identifying and representing similar concepts. The final output y1 indicates a decision-making process, where the model assigns probabilities to different outcomes.
The diagram highlights the importance of intermediate representations (concept tokens) in the LLM's reasoning process. It suggests that the LLM is not simply mapping inputs to outputs but rather engaging in a more complex process of conceptualization and inference. The diagram is a high-level overview and does not provide details about the specific algorithms or parameters used in the LLM.